With more than half a trillion-dollar market size, the advertising industry is an ever-changing world with new trends, technologies, and strategies emerging daily. It is important to stay up-to-date in this dynamic world, and getting familiar with the most recent advertising statistics is a great start. Below, you’ll find the newest industry trends broken down into digital and traditional advertising stats, fun facts, and emerging trends you should know about the advertising world.
Advertising Statistics (Editor’s Choice)
- US ad spending declined by 8% in 2020. (Search Engine Land)
- Political advertising spending reached $8.5 billion. (Forbes)
- The longest uninterrupted ad campaign lasted 25 years. (Smart Insights)
- Facebook drove over $25 billion in advertising revenue in the first quarter of 2021. (Statista)
- An Instagram ad can reach 1.3 billion users. (DataReportal)
- Video ads account for 35% of all online ad spending. (Forbes, HubSpot)
- Half of the viewers ignore TV advertisements unless they are relevant. (AMIC, Statista)
- 46% of adults said they rarely see people that look like them in advertisements. (UK Parliament)
- Nine Colgate ads have been banned in the last seven years. (BBC, Marketing Law by Osborne Clarke)
- Kids are exposed to 9-10 fast food ads every day. (Huffington Post, Chron)
General Advertising Facts and Statistics
1. Total US ad spending was 8% down in 2020.
It would be an understatement to describe 2020 as adverse. Every sector of the economy saw its fair share of pandemic-related recession, but the advertising industry was an exception. Although overall spending decreased, digital spending maintained its steady growth at 6%. Digital advertisers are the winners of this economic slump. Ad statistics confirm that digital dominance is here to stay, with digital video and display ads noting an 18% and 15% growth, respectively.
(Search Engine Land)
2. Advertising managers make $133,380 a year on average.
The overall employment of advertising and marketing managers is projected to grow by 10% from 2020 to 2030, which is higher than the average for all occupations. The US Bureau of Labor Statistics highlights the shift from traditional and print-based to internet-based advertising. Advertising industry statistics state that the employment of advertisement and promotional managers who work exclusively with traditional media is likely to decline by 1%, and they expect significant job losses soon.
(Bureau of Labor Statistics)
3. Spending on online advertising in the US is expected to be more than double that of TV advertising by 2024.
The online advertising industry has been growing at a strong pace for a while. In 2019, mobile spending on online advertising made up almost two-thirds of total advertising expenditure in the US. Online advertising vs traditional advertising statistics confirm that the gap between the two was $58 billion in 2020, while the online ad industry continues to demonstrate significant growth compared to traditional advertising’s static outlook.
(Marketing Charts, eMarketer)
4. The retail and automotive sectors in the US spend the most on advertising.
The US retail industry topped the list with $17 billion in advertising expenditure in 2018. Automotive followed with $14 billion, and both amounts were significantly larger than the budgets of other major US industries. The two verticals also increased their spending on digital advertising significantly. Advertising spending by industry statistics show that the retail industry accounted for 21.9% of the total digital ad spending, and automotive for 12.6%.
(Statista)
5. The US pharma and healthcare industry spent more than $11.2 billion on digital advertising in 2021.
Pandemic-related messages around testing and safety, telemedicine, medical supplies, and re-opening doctor’s offices drive this year’s boost in pharmaceutical advertising. Although the industry is still far behind top-tier sectors in terms of ad spending, with the growing interest in health and medical safety this year, as prescription drug advertising statistics show.
(Statista)
6. Political advertising spending reached $8.5 billion during the US 2020 elections.
Like everything else that happened in 2020, elections were special. The calculated amount is 30% higher than the $6.7 billion projected early on in 2020 and a whopping 108% higher than what was spent in midterm elections in 2018, which was a record at the time.
(Forbes)
7. It’s estimated that 27% of internet users in the US used ad blockers in 2027.
This loosely means that a quarter of paid advertisements do not reach their audience. Advertising stats show that the number one reason for using ad blockers is that websites are easier to navigate without banners. Still, users would also like to avoid irrelevant or obtrusive messages and prevent third parties from tracking their online behavior.
(Statista)
8. The average cost for a 30-second ad during Super Bowl halftime was $5.6 million.
Needless to say, that is a record high number. Super Bowl commercials have turned into a cultural phenomenon alongside the game itself, and brands and TV networks know how to make the best out of it. Super Bowl advertising statistics recorded a whopping $336 million spending in 2019. It seems to be justified with 98.3 million Americans watching the game, though. That is almost 30% of the whole country.
(Forbes)
9. “It’s a Tide ad” by Saatchi & Saatchi was ranked the top campaign by WARC Effective in 2020.
Disclaimer: This is not a Tide ad. Making the most out of their Super Bowl commercials slot, Tide not only dominated the halftime but turned all the ads into a Tide ad, quite literally. The hilarious, 1-minute video ad significantly improved the advertising effectiveness statistics of the detergent brand: 22% of customers said they bought Tide within 30 days of watching the ad.
(WARC, YouGov)
10. Absolut held the longest uninterrupted ad campaign, lasting for 25 years.
Absolut launched its brilliant campaign in the olden days of 1981. It ran for 25 consecutive years and racked up more than 1,500 variations, with one of them being designed by Andy Warhol himself. The print ads involved different designs of the now-iconic vodka bottle, with a local twist. Statistics on advertising effectiveness went through the roof. When the campaign started, Absolut sold only 10,000 cases in the US. In 2000, the number had climbed to 4.5 million cases yearly, accounting for more than half of the imported vodka in the US.
(Smart Insights)
Misleading Statistics in Advertising and Other Sensitive Issues
11. 90% of marketers are somewhat concerned that their ad will appear next to questionable content.
Among them, 41% are extremely concerned that their ad will be in close proximity to a post that includes a hot button. With the rise of political correctness and ‘cancel culture’ in the digital ecosystem, the online advertising industry has been learning to tiptoe around it.
(Search Engine Land)
12. Nine Colgate ads have been banned in 7 years.
Undoubtedly the most scandalous one was in 2007 when Colgate was called out for the misuse of statistics in advertising by the UK’s ASA. The tagline for the Colgate ad was that “more than 80% of dentists recommend Colgate”, which would be understood as 80% of dentists recommend Colgate over other brands. However, it turns out the survey asked a completely different question to dentists: they were asked if they would recommend several toothpaste brands, not only Colgate. Later on, the dental brand had eight more ads banned for different issues: claiming to heal sensitive teeth in one day, manufacturing toothbrushes with ‘sonic waves,’ and representing actresses as nurses.
(BBC, Marketing Law by Osborne Clarke)
13. Reebok had to pay an $80 million fee for using false statistics in advertising.
In 2008, Reebok released EasyTone footwear and claimed it toned and strengthened muscles as the user walked or ran. Claims included that the shoes had been proven to lead to 28% more strength and tone in the buttock muscles, 11% more strength and tone in hamstring muscles, and 11% more strength and tone in the calf muscles than regular walking shoes. All these claims had no scientific support whatsoever. Upon investigation, the FTC initially issued Reebok with a $25 million fine. It was later calculated that the whole case amounted to $80 million, a figure that made history in false advertising statistics.
(Better Marketing)
14. 46% of adults said they rarely see people resembling them in advertisements.
And 12% claim they never see images of people looking like them in advertising. The numbers are getting higher for minority groups: 69% of Black, Asian, and other ethnic minority groups said they rarely or never see themselves reflected in advertising compared to 56% of white respondents. 80% of transgender respondents rarely or never see themselves reflected in advertising, compared to 57% of cisgender respondents. Apart from lack of representation, advertising and body image statistics suggest that people are struggling with their body image due to being constantly exposed to edited pictures in advertising, which indicate their body should look a certain way.
(UK Parliament)
15. 28% of cosmetic ads include disclaimers noting that the images were retouched.
According to a report released by the Sun, 44% of ads appear to be digitally enhanced yet have no disclaimers indicating they are. The report singled out mascara ads as using photoshop more frequently than other products: 58% admitted that the model’s eyelashes were airbrushed, and 42% showed artificial lashes, Photoshop in advertising statistics show.
(HuffPost)
16. One in 10 teenagers in the UK sees alcohol advertising daily or almost daily.
The research did not find a correlation between alcohol consumption and direct advertising, though. Rather, there is a correlation between alcohol merchandise ownership and susceptibility among teenagers in the UK. Almost a fifth of the participants reported owning alcohol-branded merchandise. After controlling for demographics and confounding variables, those who owned such merchandise turned out to be twice as likely to be susceptible than those who did not.
(Alcohol Policy)
17. Advertising statistics for Australia show that in 2018, sex, sexuality, and nudity accounted for 36.39% of all complaints to the nation’s Ad Standards.
The millennial age witnesses the questioning of the age-old imperative ‘sex sells’ alongside many others. Sexual imagery dominated the advertising scene in the late 90s and early 2000s, becoming a signature ad format for many high-end brands like Calvin Klein or Dolce & Gabbana. People began to criticize this trend of ‘sexualized marketing’ for perpetuating gender stereotypes around the 2010s. As a result, sex in advertising statistics began to record more and more consumers’ complaints over the last decade.
(Better Marketing, Ad Standards)
18. Kids are exposed to 9 to 10 fast-food ads per day.
Although the American Academy of Pediatrics issued a call for all fast-food ads to be banned from television due to the growing rates of childhood obesity in the country, the US government is yet to take action on it. Even if the government issued a ban, the highly sophisticated marketing mechanisms of online advertising remain very hard to police. Fast-food advertising statistics show that non-direct advertisements like embedded marketing or product placement result in higher susceptibility levels among young children. According to a study conducted in 2018, brands introduced through methods like product placement are recalled more frequently than mere advertisements.
(Huffington Post, Chron)
Digital Advertising Statistics
19. The total number of social media users is close to 4.5 billion.
That is 61% of the global population. Let that sink in. This indeed means impressions of social media ads are growing, 13.1% to be precise. How many people actually take action is another issue, though. According to Statista, the click-through rate for social media ads is concerningly flat. It was calculated at 1% in the second quarter of 2021, according to social media advertising statistics.
(DataReportal, Statista)
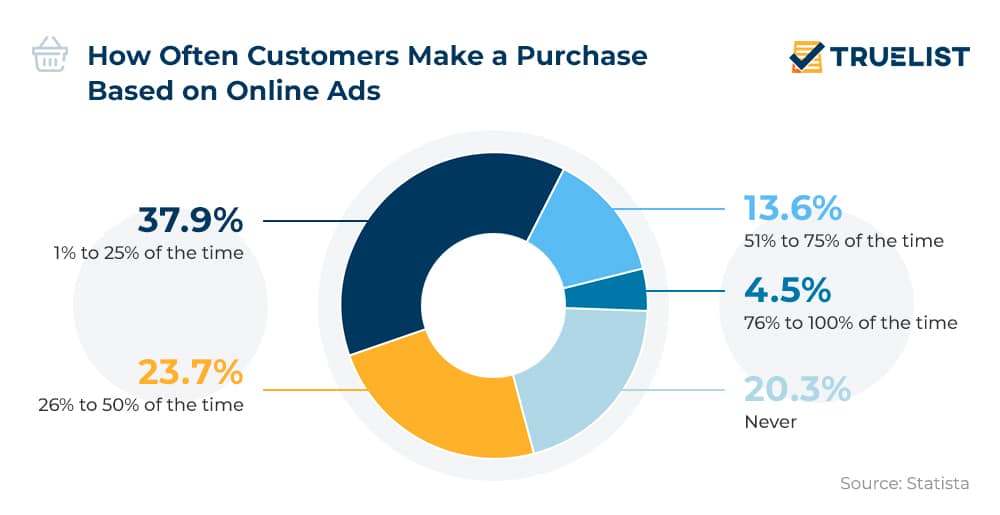
20. 37.9% of consumers said they make a purchase 1% to 25% of the time based on an online or social media ad.
20% of respondents stated they never make a purchase based on an online advertisement, and only 4.5% said they make purchases 76% to 100% of the time. The frequency of purchases based on online ads roughly shows the effectiveness of this form of advertising. Although online advertising statistics like this do not look promising, industry leaders expect the numbers to go up with the rise of online shopping amid the COVID-19 pandemic. With the shops closed and governments instructing people to stay home, people have no choice but to do their shopping online.
(Statista)
21. Mobile ad spending is expected to hit $156.38 billion by 2023.
Budget restrictions occurred in almost every business aspect due to the COVID-19 related recession. Yet, on the bright side, nationwide lockdowns increased mobile usage significantly: research shows that today a typical American spends 5.4 hours on mobile. Although dampened by the economic crisis, mobile advertising statistics estimate a steady increase in mobile ad spending with increased usage.
(eMarketer, ZDNet)
22. In the first quarter of 2021, Facebook drove $25.4 billion in revenue from advertising.
Despite Facebook Ad Boycotts in July last year, the tech giant did not lose much ad revenue. The series of boycotts, under the Stop Hate for Profit campaign, kicked off after the social network refused to take action against hate speech remarks circulating on the site. Despite the involvement of some notable brands like Adidas and Volkswagen, the campaign was short-lived. Facebook advertising statistics show that the platform is still advertisers’ favorite. 61% of social media marketers use Facebook ads, and they have every reason to do so. The platform is expected to reach nearly $95 billion in global ad revenue in 2021.
(Statista)
23. An Instagram ad can now reach up to 1.39 billion users.
Instagram welcomed 100 million users to its advertising reach in the past three months, equating to quarterly growth of 7.5%. These figures mean that 1.1 million users are added to Instagram’s ad audience per day. Instagram advertising statistics suggest that the platform is getting closer to beat its older brother Facebook to become the most beloved advertising platform.
(DataReportal)
24. Snapchat users are 60% more likely to make impulse purchases.
According to Snapchat’s data, the platform reaches 90% of all 13 to 24-year-olds and 75% of all 13 to 34-year-olds in the US. Millennials and Gen Z generations, which Snapchat reaches the most, have a combined spending power of $1 trillion. With the engaging and interactive features of the platform, Snapchat advertising statistics suggest that the channel still has some potential as an ad channel that is currently generating $2.62 billion in ad revenue.
(Snapchat)
25. More than 70% of consumers say YouTube makes them more aware of new brands.
Like it or not, YouTube is doing wonders for brand visibility. Besides the astronomic reach, it also has tools like Director’s Mix that make the life of a marketer much easier. The tool can generate close to 250 customized versions of a 15-second ad by layering video elements and serving personalized ads, which have become quite popular in recent years. YouTube advertising statistics also suggest that viewers are two times more likely to buy something they saw on the platform and four times more likely to use it to find information about a brand, product, or service when compared to other channels.
(YouTube, Think with Google)
26. Video ads now account for more than 35% of all ad spending online.
There is no denying that we are living in an audiovisual age. Experts go as far as to claim that it will dominate the upcoming decades. According to video advertising statistics, marketers mostly use videos to promote products and services and for brand storytelling.
(Forbes, HubSpot)
27. Promoted tweets cost $0.50 to $2 per action.
Despite the unpopularity, Twitter advertising statistics show that it maintains competitive pricing. According to one of the leading video marketing companies, WebFX, promoted tweets cost $0.50 to $2 per action; promoted accounts cost $2 to $4 for each follow, while promoted trends can cost as much as $200,000.
(WebFX)
28. About 42% of sites use native advertising.
For the people in the back, native advertising is advertising in disguise. It refers to paid content in the form that matches the look, function, and feel of the media format in which they are published. They are less obtrusive, as their main premise is being subtle. Native advertising statistics confirm that disguised paid ads are now a full-blown industry of their own: in 2018, the spending amounted to $35.24 billion. Big publishing houses like The New York Times had a big role in its popularization by proving that branded content can still have the format of high-end journalism.
(Statista)
29. LinkedIn’s ad audience grew by 3% quarter-on-quarter in 2021.
Today, a LinkedIn ad can reach up to 768.2 million users and has proven to be 277% more effective than Facebook and Twitter in generating new leads, LinkedIn advertising statistics show. Add to that the platform’s high lead conversion rates of 2.74%, and it makes perfect sense to invest some of your marketing budget into LinkedIn marketing.
(DataReportal)
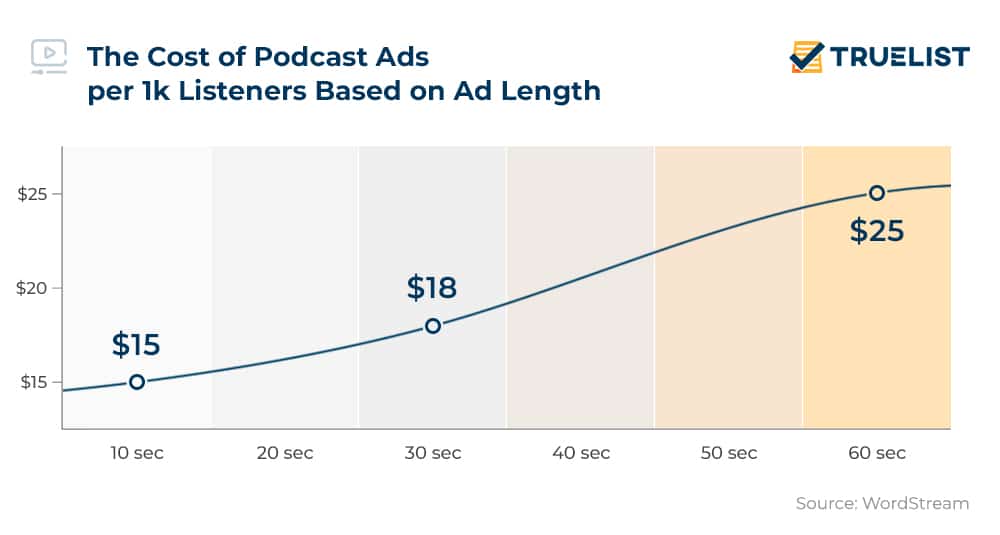
30. 75% of podcast listeners follow specific calls to action upon hearing them.
The number of podcast listeners has grown tremendously in the last few years. In 2006, only 22% of Americans were aware of podcasts. In 2020, 75% of the public was aware of podcasts, and there were an estimated 88 million listeners across the country, as podcast advertising statistics
(WordStream)
Traditional Advertising Statistics
31. TV’s share of advertising is expected to grow by 8.0% in 2022.
TV advertising statistics reveal that the rise of subscription-based streaming platforms like Netflix, Amazon Prime, and Disney+, which happen to offer ad-free service, has sealed the much-anticipated downfall of the TV advertising industry. To catch up with the trends, traditional TV networks are also investing in their own streaming services, like HBO Max or NBC’s Peacock.
(Zenith Media, GroupM)
32. Half of the viewers ignore TV advertisements.
Despite being overpowered by streaming platforms, TV indeed maintains its enormous reach. Research shows that 82% of respondents have watched live TV in the prior month, and the average time devoted to broadcast TV is 3 hours a day. Advertisements, however, are a different story. Almost half of the viewers look the other way when ads come up while they are watching a show, as commercial statistics show. It’s not all gloomy though, 21% of the same group also said that they don’t skip the ads that are relevant to them.
(AMIC, Statista)
33. The compound annual growth rate for TV advertising is projected to be 0.4%.
The more people make online sources their default for viewing, the fewer media buyers invest in traditional TV advertising. While broadcast TV advertising’s overall growth remains flat at 0.1% and cable networks are still expected to see a 0.3% CAGR for the upcoming years, television advertising statistics demonstrate a decline in multichannel systems advertising, at -1.5%.
(Marketing Charts)
34. 45% of Americans notice billboard ads more than before the pandemic began in 2020.
As COVID-19 crept into our lives and locked us into our homes, it also pushed us to rethink our daily lives. Commuting to work feels more bearable, while trips for groceries are like a blessing. 69% of people surveyed said they have an increased appreciation for outdoor surroundings, and 65% are interested in taking a road trip. They have a heightened receptivity for outdoor advertisements as well, and even more when they are useful. Billboard advertising statistics show that people particularly enjoy when they learn new information from advertisements they see outdoors.
(PR Newswire)
35. 53% of consumers are influenced by newspaper ads.
Newspaper ads are not having their golden times, but they are not that close to dying off either. An MRI Survey of the American Consumer found that a significant amount of consumers still value printed ads. Based on newspaper advertising statistics and experts’ opinions, this trust in the printed material stems from the established credibility of print publications. While advertisers can easily leverage the reliability of print publications, those lack the increased targeting online advertising provides. Experts believe that it comes down to the brand itself and the nature of the product or service to decide which option is more effective.
(Latana)
36. Print ad spend is projected to decline by 18.9% between 2019 and 2021.
The disinvestment in print advertising accelerated with COVID-19 in 2020. According to print advertising statistics, the steep decline caused by print ads’ reliance on local businesses resulted in this type of advertising receiving the biggest hit from the pandemic. Advertisers also think that it is no longer cost-efficient to advertise on printed material: the share of time spent consuming print media remains lower than advertising money spent on print.
(L.E.K)
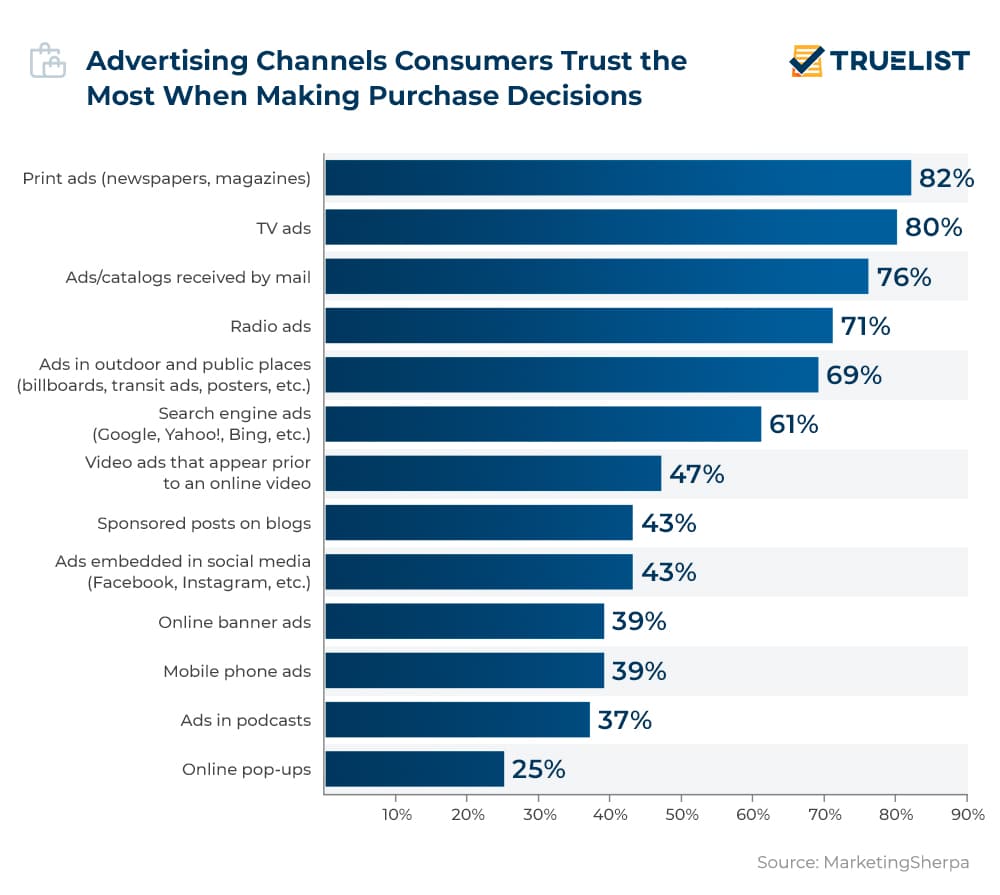
37. 82% of consumers said they trust print ads the most when making purchasing decisions.
The digital world is a jungle full of possibilities, and the advertising industry is having a blast coming up with innovations. Consumers, on the other hand, do not share most of their excitement, and direct mail advertising statistics can confirm that. To cause even more disappointment, none of the online ad channels make it to the top five. Alongside direct mailing, consumers trust other older and offline options such as print, radio, or TV ads.
(MarketingSherpa)
38. The global radio advertising market declined to $19 billion in 2020.
This number is down from $19.6 billion in 2019. The decline is mainly due to the budget restrictions in the wake of the COVID-19 outbreak combined with the ongoing trend of moving away from traditional advertising channels, as reflected in radio advertising statistics. While traditional broadcasting still has the largest share in the radio advertising market, online radio advertising is projected to grow by 7.1% and reach $2.6 billion in 2024.
(Report Linker, Inside Radio)
39. 47% of Millennials said car wrap advertisements are easily remembered.
A classic method of out-of-house advertising, car wrap remains a cost-efficient way of increasing brand visibility. Media-targeted vehicles reach 95% of the citizens living in the area with an average length trip, according to vehicle wrapping advertising statistics by the Outdoors Advertising Association of America. At only $0.35, the average cost of a thousand impressions of vehicle advertising is quite low compared to other offline ad options.
(Kopytek)
40. The average conversion rate of door-hanging advertising goes up to 5%.
The rate, of course, depends on how attractive the offer and how compelling the artwork is. As marketers are trying to alter their strategies under the biggest economic stress since World War II, simple yet elegant methods like door-hanging advertising surface again. Door hanger advertising statistics confirm that this type of advertising may be a feasible and cost-efficient option to try for local businesses.
(Think Flyers)
41. 80% of consumers own promotional t-shirts.
Promo t-shirts smell awfully like teen spirit, but they do wonders for increasing brand visibility. Bound to become pajamas or dust cloths in the future, during their lifetime, they can generate up to 3,400 impressions. Along with drinkware products, t-shirts are customers’ favorite free delights. T-shirt advertising statistics show that consumers keep these t-shirts up to 14 months, and a logoed t-shirt that costs $7 will have a CPI of only 2/10 of a cent.
(ASI)
42. A bus advertisement can reach 87.8% of all adults and 94.3% of 15 to 24-year-olds.
These figures, of course, were collected in a pre-pandemic world where everyone was out and about. We will not be under lockdown forever (hopefully), so there is no point in losing faith in buses. The latest bus advertising statistics show how useful it is to have a brand name on one. 61% of consumers stated that they had seen ads on buses within the last seven days, and 29% of adults actually use buses to commute for a minimum of an hour a week.
(Statista, Adverta)
Advertising Statistics FAQ
What is the rule of 7?
A marketing principle developed by the movie industry in the 1930s, the Rule of 7 states that a potential customer needs to hear the advertiser’s message at least seven times before becoming a paying customer. During the depression era, studio bosses realized that a certain amount of advertising was required to convince people to see their movies, which led to the idea that marketing efforts should be repetitive and consistent to be successful.
(Kruse Control)
How many advertisements is a person exposed to in a day?
There are no official advertising exposure statistics released since 2007. Back then, the market research firm Yankelovich calculated that one person saw up to 5,000 advertisements a day on average, with many of the respondents considering the situation as ‘out of control.’ Today, with the unprecedented use of social media, experts believe that figures are well above 10,000.
(PPC Protect)
What companies spend the most on advertising?
After steady growth, Amazon finally ranks first as the biggest ad spender that spent more than $6 billion in 2019. Long-term number one, Comcast Corp. remained in second place, followed by AT&T, Protect & Gamble, Walt Disney Co., and Alphabet (Google), according to statistics on advertising expenditure.
(Statista)
Who spends the most on Google ads?
Amazon dedicates a significant amount of its advertising budget to Google ads alone. According to the latest records, the tech giant has a monthly budget of $17.4 million. The search engine info.com and review site ConsumersAdvocate.org spend $12.3 million and $6.72 million, respectively. Geico closes the top 5 Google Ads spenders with $5.15 million spent on the ad platform.
(SpyFu)
What industries spend the most on digital marketing?
The retail and automotive industries are the biggest digital marketing spenders at 22% and 12%, respectively. Although the automotive industry received a blow with the COVID-19 pandemic, experts flag a quick recovery due to the long sales cycle of the industry. Advertising facts show that the fastest growing industries in digital marketing are computing products and consumer electronics, and healthcare and pharma industries, at 28.2% and 18%.
(Statista, eMarketer)
How big is the advertising industry?
The global advertising market size is estimated to reach $630 billion by 2024. The steady growth of the industry received a blow with the outbreak of the coronavirus but should be back on track during 2021. North America is the biggest investor in the industry, followed by Asia and Western Europe. The Middle East, Africa, Central, and Eastern Europe spend the least. The largest advertising market is in the US, while the fastest-growing market is China, according to advertising statistics worldwide.
(Statista)
Conclusion
Despite dampening with the pandemic that broke out in 2020, the advertising industry is dynamic enough to adapt to changes and be a strong agent in the ‘new normal.’ Apart from economic stress, people’s tastes, preferences, and interests are also shifting rapidly. It is now more important than ever for advertisers to equip themselves with the right data coming from the most relevant advertising statistics and adjust their strategies accordingly.
Sources: Search Engine Land, Forbes, Smart Insights, Statista, DataReportal, Forbes, HubSpot, AMIC, Statista, UK Parliament, BBC, Marketing Law by Osborne Clarke, Huffington Post, Chron, Bureau of Labor Statistics, Marketing Charts, eMarketer, Statista, Statista, Statista, Forbes, WARC, YouGov, Better Marketing, Alcohol Policy, Better Marketing, Ad Standards, Statista, Statista, eMarketer, ZDNet, Snapchat, YouTube, Think with Google, WebFX, Statista, Statista, WordStream, Zenith Media, GroupM, PR Newswire, Latana, L.E.K, MarketingSherpa, Report Linker, Inside Radio, Kopytek, Think Flyers, ASI, Statista, Adverta, Kruse Control, PPC Protect, Statista, SpyFu, Statista, eMarketer, Statista