What are the odds that you have streamed something just today? Probably high. From music, sports events, and concerts, to movies and TV shows, much of the entertainment today comes to us on the waves of streaming services. That’s why we prepared some essential streaming statistics to walk you through the fascinating world of streaming, which might soon replace traditional forms of entertainment.
Streaming Statistics (Editor’s Choice)
- In 2021, the video streaming market value amounted to 59.14 billion. (Grand View Research)
- The live streaming industry saw a 99% increase in hours watched between 2019 and 2020. (DailyEsports)
- In 2019, video accounted for 60% of downstream traffic online. (NCTA)
- Globally, 89% of people listened to music via on-demand services in 2019. (IFPI)
- YouTube has over 2 billion logged-in users on a monthly basis. (YouTube)
- In 2020, Netflix invested $17.3 billion in content. (Variety)
- Over 50% of users abandon poor-quality streaming in up to 90 seconds. (TechRadar)
- In 2021, 32% of music streamers worldwide had Spotify subscriptions. (Statista)
Exciting Video Streaming Statistics
1. In 2021, the video streaming market value amounted to 59.14 billion.
Moreover, the annual growth rate of this segment between 2022 and 2030 will most likely be 21.3%. The biggest drivers of the fast market growth are artificial intelligence and blockchain technology. For example, AI plays a vital role in cinematography, voice-overs, and other similar components of video production. Quite a few video providers, most notably Netflix, have introduced AI into their operations to improve their content and personalize customer experience.
(Grand View Research)
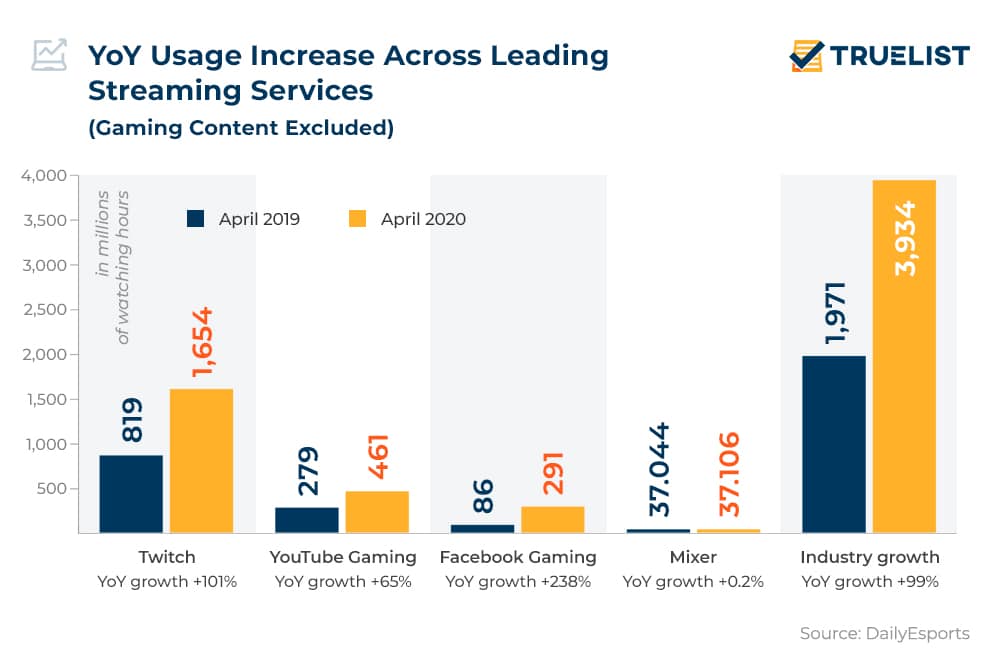
2. The live streaming industry saw a 99% increase in hours watched between 2019 and 2020.
It all started with the 2020 lockdown. Non-essential workers were home and spent much of their time streaming. Some of the services experienced more than spectacular growth. Take, for example, Facebook Gaming. According to the video game streaming statistics, this service had 238% year-over-year growth. Similarly, Twitch witnessed 101% growth compared to the year before. At 65%, YouTube Gaming’s rise was less impressive but still considerable.
(DailyEsports)
3. YouTube broke a record in 2019, gathering over 82.9 million live views on their live-streaming of Coachella.
With nearly 70 artists live-streaming their performances, no wonder the audience doubled. This also marked the platform’s largest audience since YouTube started streaming Coachella exclusively in 2011.
(Variety)
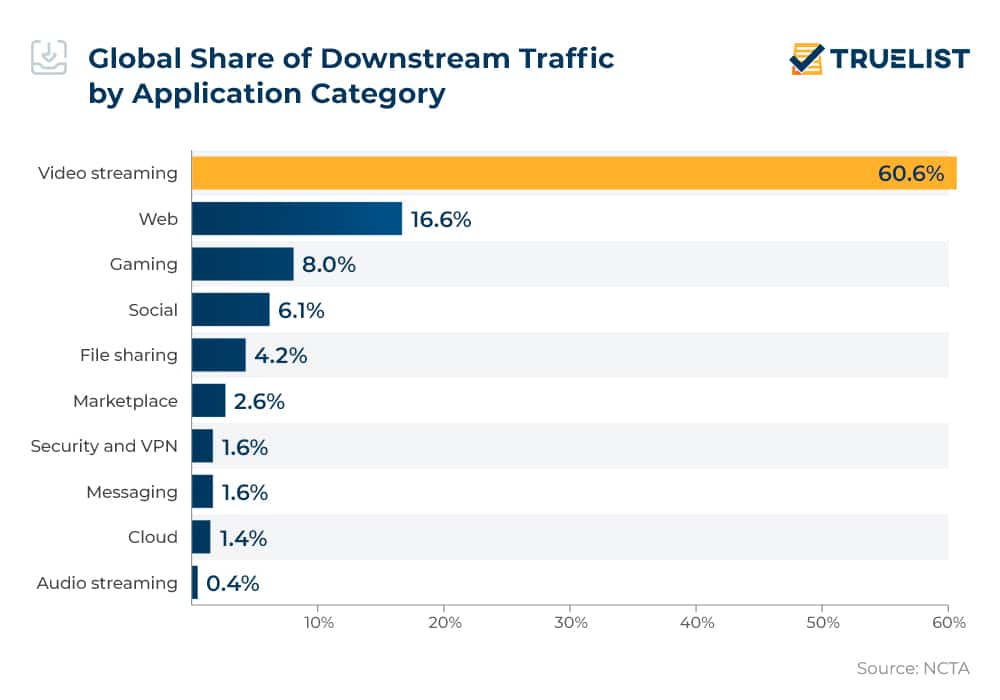
4. In 2019, video accounted for 60% of downstream traffic online.
While the number is close to the year prior, the result marked a shift in the sources of the video content. Online video streaming statistics show that a lot of consumers are turning to HTTP Media Stream providers (23.8% of global video streaming traffic). These are, on the other hand, content owners who share that content with users. Some of these require customers to connect with a TV provider account, while others come free of charge.
(NCTA)
5. The live streaming market in China grew at a 119% rate in 2020.
In line with the rise of streaming services and the latest data, the market in China generated ¥456.12 billion (circa $71.4 billion) in the first half of 2020, as opposed to only ¥19.64 billion (circa $3.1 billion) in 2017. Moreover, the number of streaming services users in China rose to 309 billion, or 34.2% of all internet users in the country. Recent stats suggest that the top three platforms in China for live streaming are Douyin, Taobao, and Kuaishou.
(Daxue Consulting)
6. About 61% of young people in the US watch television primarily with streaming services.
This makes up approximately six out of 10 18-29-year-olds. If we compare streaming vs cable statistics, we have 31% of those watching television using satellite or cable subscriptions. Finally, 5% mostly watch it using a digital antenna. Other age ranges are less likely to say that they prefer streaming services to traditional methods. Only the next age group, 30-49-year-olds, show signs of strong use of streaming services (37%). However, in their case, 52% still prefer cable.
(Pew Research)
7. About 86% of companies use video as a marketing tool.
The share of companies using video for marketing hovered around this number in the previous two years, having jumped around some 25% since 2016. As a matter of fact, 92% of marketers confirm video is an extremely important tool in their marketing strategy. According to the latest video marketing statistics, the most common video formats are explainer videos (73%). Next, we have social media videos with 67%, presentation videos (51%), sales videos, and ads (both 41%).
(Wyzowl)
8. More than half of users abandon poor-quality streaming in a maximum of 90 seconds.
If a company wants to show ads during the stream, poor quality could undoubtedly affect that strategy. For instance, if customers leave in under 90 seconds, they won’t get to see ads. Online streaming statistics further show that one in six customers would switch to another service if they had a more adequate live option.
(TechRadar)
9. It was estimated that about 3.37 billion users worldwide will watch digital video content in 2022.
This number is set to reach over 3.48 billion by 2023. The main driver behind this is for sure the improvement in mobile connectivity. To clarify, the broadband enhancements have raised the bar for the viewing experience. The streaming in the US and Canada, for example, is at a pretty high level. Further, the most popular apps with video content in the US were Netflix, YouTube, and IMDB.
(Statista)
10. More than 77% of US users aged between 15 and 35 have accessed YouTube.
If we look at video streaming industry statistics, we will notice that YouTube alone has over 126 million unique monthly viewers. Considering its free content and this number of users, it’s most interesting to younger viewers. For example, over 77% of US users between 15 and 35 have accessed YouTube.
(Statista)
11. Streaming statistics show that the number of teens in the US watching videos online jumped to 69% in 2019.
This is twice as much as back in 2015. For reference, back then, only 34% of teenagers watched videos online. Likewise, the number of tweens watching online videos boomed as well. For instance, it rose from 24% in 2015 to 56% in 2019. But it’s no wonder, considering that many young people receive their first smartphones much earlier lately. By the age of 12, in 2019, around 69% of them got one, marking a 41% increase from 2015.
(ABC News)
Music Streaming Statistics
12. In 2019, the US reached a milestone of 1.15 trillion audio and music video streams.
Nielsen’s report indicates that this was the first time this happened, marking a 29.3% increase compared to 2018 when there were 887.4 billion streams. In 2019, the most-streamed song was Lil Nas X’s “Old Town Road,” with over 2.5 billion streams. Quite a stunning figure, especially if we consider that the runner-up (Post Malone’s and Swae Lee’s “Sunflower”) had 1.5 billion. Third on the list was “Bad Guy” by Billie Eilish, which reached 1.3 billion.
(Pitchfork)
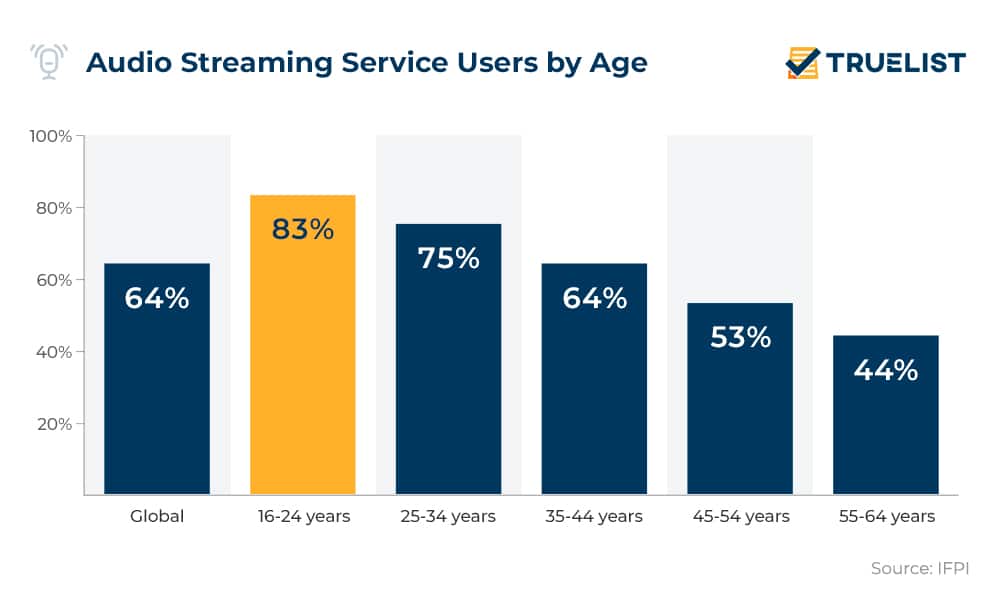
13. Globally, 89% of people listen to music via on-demand services.
The age group between 35 and 64 registered the highest growth in using streaming for music. When asked whether they listened to music on streaming services in the past month, 54% of this age group confirmed it. Music streaming stats show that this is an 8% increase year-over-year. In younger generations (16-24), 52% said they had listened to music streams in the past month. Similarly, around 63% listened to it on the day before the survey.
(IFPI)
14. Online streaming accounted for over 80% of the music consumption in the UK in 2020.
This info comes from Official Charts Company, which released data just a few days after Spotify’s stocks hit a new record high on NYSE. Streaming stats further confirm that there were 139 billion audio streams in 2020. Compared to the previous year, it’s up by a fifth, with around 200 artists streaming over 100 million times in the UK. On the other hand, despite the rise of streaming services, the report shows that 82% of artists earn £200 (circa $280) or less from streaming.
(DJ Mag)
15. The Weeknd’s “Blinding Lights” was the most streamed track on Spotify in 2020, with over 1 billion plays.
Moreover, it speaks volumes about the popularity and significance of this song that was released on November 29th, 2019, and in one year, it managed to win the ‘ears’ of so many people worldwide. The Weeknd is also one of the industry’s most-streamed artists, with many more hits, like “Can’t Feel My Face.”
(The Wall Street Journal)
16. Live streaming statistics show that at the end of 2020, 24% of music consumers had watched a live-streamed performance in the prior two weeks.
In addition to that, another 40% said they were planning to do so in the following two weeks. Similarly, 28% would gladly pay to watch livestream concerts. In the US, for example, during the first lockdown, 19% of the population watched live streaming. Moreover, 25% pointed out they would probably do the same too. Therefore, the COVID-19 pandemic has only set off a new type of consumer behavior, causing interest in virtual concerts to grow in general. Some reports even prove that users would continue to enjoy virtual concerts ever after the quarantine is over.
(Music Business Worldwide)
Streaming Services Statistics
17. During the lockdown in 2020, the viewership of video streaming services increased by 10%.
COVID-19 pandemic has entrapped over a quarter of the global population in a lockdown. The logical outcome was the rise of streaming services and increased usage of VPNs for streaming. While at home, many of these people chose online streaming to escape boredom and find entertainment. The viewership not only increased, but this was a drastic jump up for many platforms, including Amazon Prime Video, YouTube, Netflix, Disney+.
(Grand View Research)
18. Netflix boasts a base of 200 million paid subscribers.
Netflix streaming statistics confirm COVID-19 proved a boon for the platform. Netflix gained over 8.5 million paid subscribers in the last quarter of 2020 alone. This was mainly due to the surge of virus again in the winter months and another wave of lockdowns. Furthermore, in 2020, Netflix accumulated 37 million new subscribers in total and compared to the previous year, this is a 31% increase. Last quarter’s success, Netflix mostly owes to The Crown. In just 28 days, the number of households that watched the show’s fourth season rose to a spectacular 100 million.
(Fast Company)
19. YouTube has over 2 billion logged-in users on a monthly basis.
These users generate billions of hours of video, as well as views each day. YouTube streaming statistics further show that the platform’s users upload over 500 hours of video every minute. You read it right – every minute, people publish 500 hours of different content to this streaming platform.
(YouTube)
20. In 2020, Netflix planned to invest $17.3 billion in content.
This represents an increase year on year and a difference of around $2 billion. And this is not the end. The streaming giant plans to invest $26 billion by 2028. The majority of the content budget in 2020 was earmarked for original productions, as indicated by Netflix streaming stats. Some of the recently announced projects include the multi-year deal with David Benioff and Dan Weiss, the men behind “Game of Thrones.” In addition, the streaming platform secured multi-year cooperation with Nickelodeon for animated originals, as well as a three-year contract with the South Korean CJ ENM’s Studio Dragon. This will up the hand for Netflix in the Asia Pacific region.
(Variety)
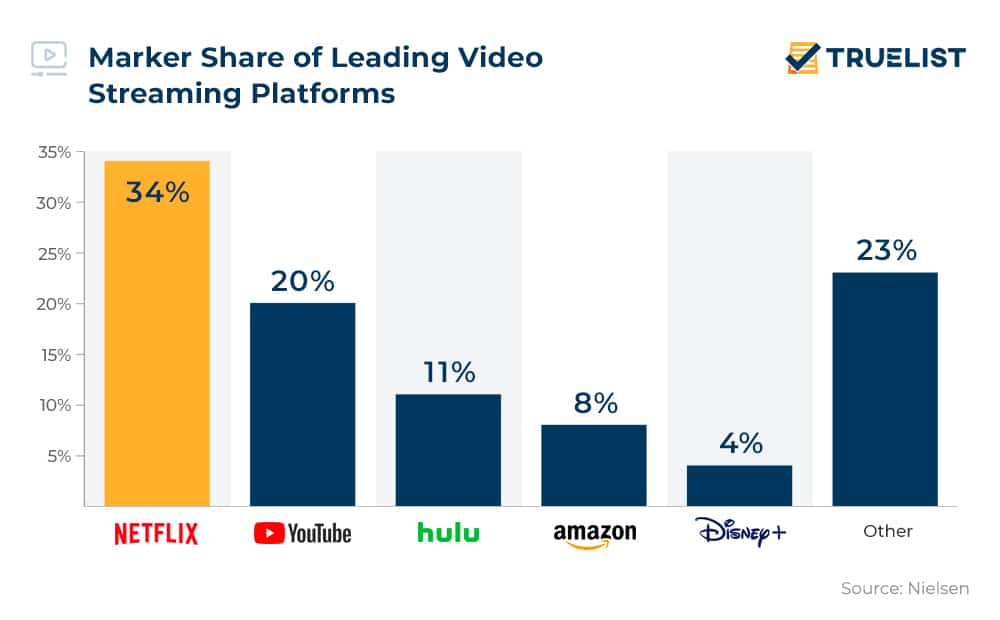
21. Netflix comprised over one-third of the entire streaming in 2020.
According to the Nielsen report, streaming accounts for one-fourth of all television minutes. Following that, its findings confirm that Netflix dominates the streaming market with a 34% share. Streaming stats show that YouTube is closely behind, with a share of around 20%. Hulu and Amazon are next on the list with 11% and 8% share, respectively. Finally, Disney+ was the biggest surprise of the year, growing extremely fast to 4% of the total streaming.
(Nielsen)
22. Disney+ gained 10 million subscribers in its first day alone.
This platform recorded stellar growth in a short amount of time since launching, despite some initial difficulties. Apart from the 10 million people subscribing the first day, people downloaded its app 3.2 million times in the same period, according to Apptopia’s video streaming stats. One of the main drivers of its massive success is the crown jewel of the service — The Mandalorian. This live-action Star Wars universe show registered 2 million streams the very first day.
(The Verge)
23. 4 million people in the US have subscribed to Hulu’s live TV bundle.
This product consists of live programming, with a combination of the on-demand library, and is gaining a lot of popularity. It’s no wonder that the company added 800 thousand new live TV users, Hulu streaming statistics confirm. And right before the pandemic, Hulu’s market share in the live TV sector increased from 31% to 34%.
(Backlinko)
24. In 2020, of 61% of Americans who subscribed to Amazon Prime Video, 84% were Netflix subscribers as well.
Users often subscribe to multiple services, especially due to the pressure to access content that is unique to each of them. Hulu users had subscriptions to both Amazon and Netflix, or Apple TV+ and HBO Max.
(Statista)
25. The average number of viewers on Twitch amounts to 2.84 million.
This live streaming platform offers great gaming video content. Twitch streaming statistics show that this service has reached a record of 6.13 billion hours watched. To put this number into perspective, it’s twice the amount of time spent by both YouTube Gaming Live and Facebook Gaming users.
(Statista)
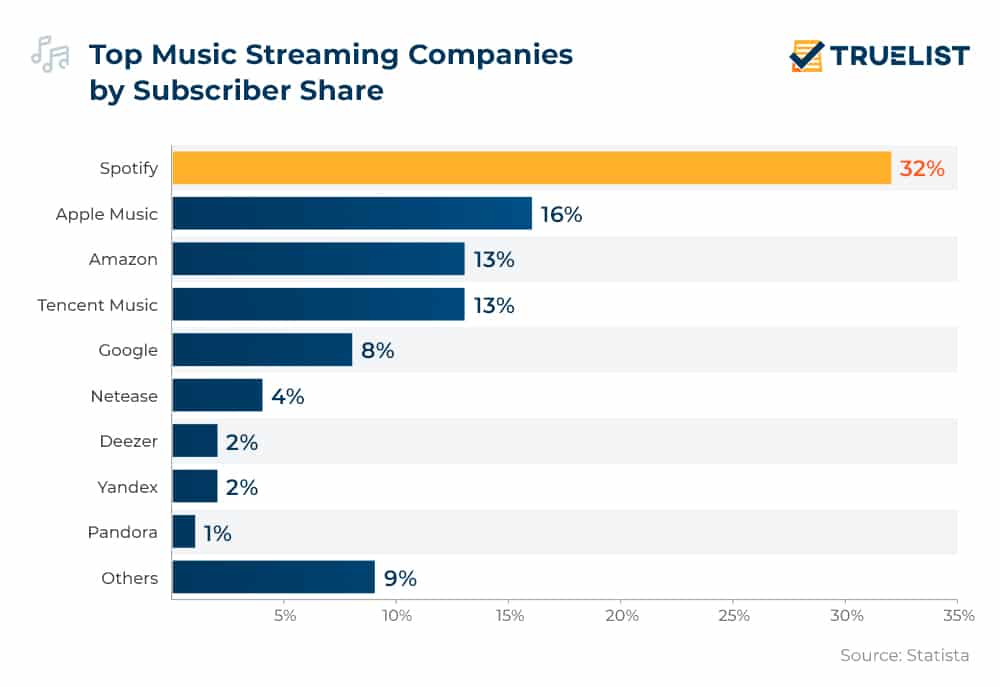
26. In 2021, nearly a third (32%) of music streamers worldwide had Spotify subscriptions.
That made it by far the biggest music streaming service globally. Especially if we take into account that rival Amazon has only a 13% share of audio streaming. Despite the largest subscriber base, Spotify didn’t dominate the market completely. Although it can’t compare to Spotify streaming statistics, France’s Deezer has tripled its base in only a few years. Other popular services include Apple Music, a strong competitor to Spotify in the field of music streaming in the US, Pandora, and YouTube.
(Statista)
27. Spotify listeners from North America spend 140 minutes per day on average on the app listening to music.
When it comes to Spotify’s usage by region, North America is the leader, with users spending nearly 2.5 hours listening to music. Streaming statistics further show Europe has the lowest average time users spend on Spotify (99 minutes per day).
(Business of Apps)
28. About 30% of total VPN users access Netflix every month.
American expats, in particular, are extremely interested in watching US TV shows. According to the VPN streaming statistics, roughly three out of 10 VPN users turn to such services to bypass geo-blocked content on Netflix. Translated into actual numbers, it’s over tens of millions of people. 49% of VPN users in both Canada and Mexico are using VPN to access Netflix.
(G2)
The Bottom Line
Hopefully, these streaming statistics gave you a better idea of this new form of entertainment. Streaming lets consumers feel more connected to those who broadcast, allowing them to actively participate and access entertainment at any time, anywhere. And while the COVID-19 pandemic will hopefully be over in the near future, streaming is unlikely to lose steam anytime soon.
Sources: Grand View Research, DailyEsports, Variety, NCTA, Daxue Consulting, Pew Research, Wyzowl, TechRadar, Statista, Statista, ABC News, Pitchfork, IFPI, DJ Mag, The Wall Street Journal, Music Business Worldwide, Fast Company, YouTube, Variety, Nielsen, The Verge, Backlinko, Statista, Statista, Statista, Business of Apps, G2