It’s no secret that apps have turned our daily lives around. We use them to meet new people, stay in touch with our loved ones, get a ride, order food, and much more. What used to be an entertainment industry turned into a billion-dollar market in a matter of years. That’s why we prepared the most relevant apps statistics, which will hopefully give you some ideas on how to utilize apps to benefit your business this year and beyond.
Apps Statistics (Editor’s Choice)
- The number of mobile game downloads in 2022 is 55 billion. (Business of Apps)
- There are over 2.8 million apps on Google Play Store. (Sensor Tower)
- 51% of US smartphone users don’t download apps. (TechCrunch)
- 81% of people have Facebook installed on at least one of their devices. (We Are Social)
- PUBG Mobile brought in $2.6 billion in 2020. (SensorTower)
- More than 40% of all fitness and health tracking device users are in the 30-39 age group. (Statista)
- There are around 2 billion mobile banking app users. (Retail Dive)
Apps Download Statistics
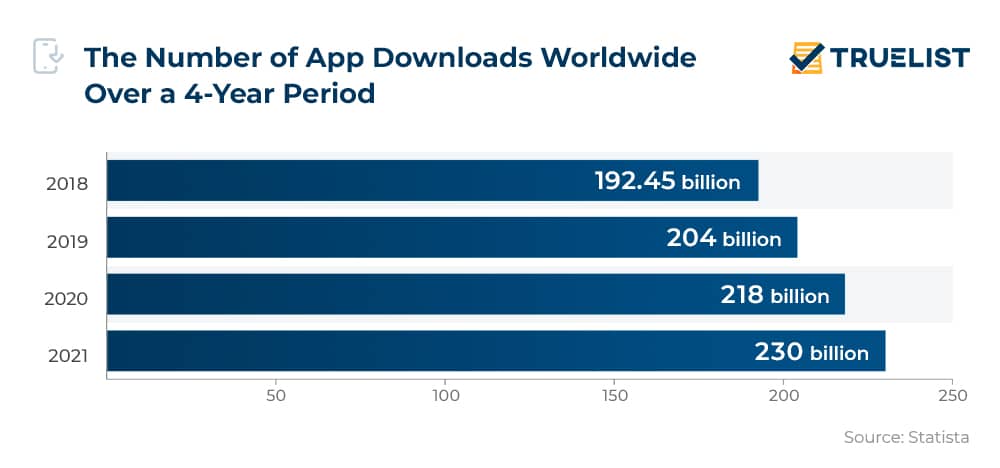
1. There were 230 billion app downloads in 2020.
2020 saw a 6.8% app download increase compared to 2019, when 204 billion downloads took place. The numbers show no sign of stopping, and the 63% jump from 2016 to 2020 just proves it.
(Statista)
2. TikTok ranks first on the list of the most downloaded apps in 2020.
TikTok has taken the world by storm since 2016. It was the most downloaded app in the US and worldwide in 2020. Last year, TikTok was also the highest-grossing app in the world, netting $540 million.
(Apptopia)
3. Mobile game downloads amounted to 55 billion in 2022.
Since mobile app download statistics show that game and app downloads on iOS declined for the first time last year, from 34 billion downloads in 2020 to 32 billion in 2021. On the other hand, Google Play app and game downloads grew in 2021 by 2.5%, which was the lowest-recorded percentage of growth until now.
(Business of Apps)
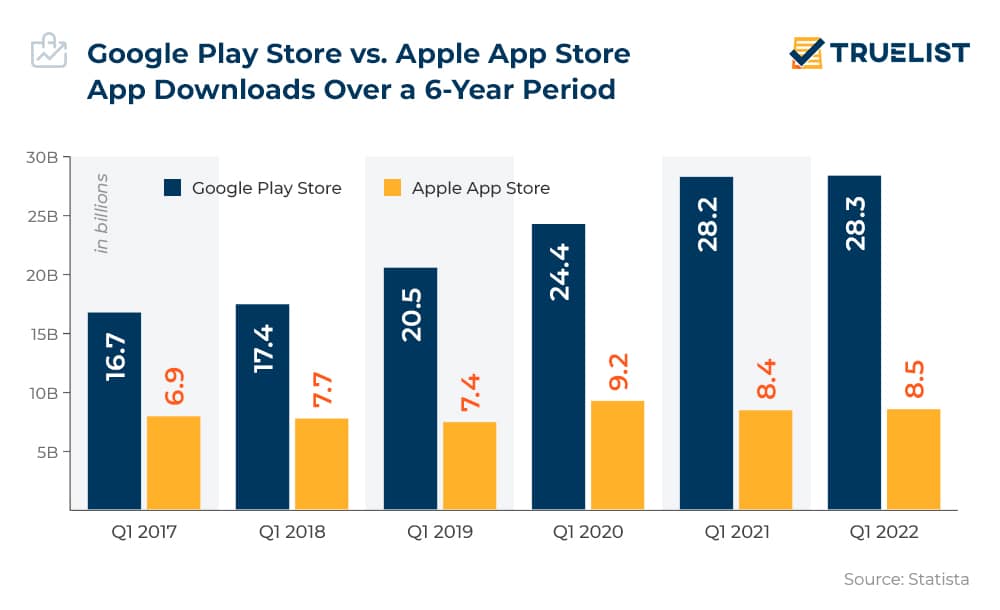
4. Users downloaded about 28.3 billion apps from Google Play in the first quarter of 2022.
In the Q1 of 2022, users downloaded roughly 28.3 billion apps from Google Play. On the contrary, mobile app generated only around 8.5 billion downloads in the Apple Store. The Google Play platform is a better option when app downloads are in question, but the Apple App Store has always been stronger in terms of revenue generation.
(Statista)
5. 6.1% of all App Store downloads are paid-for downloads.
iPhone app download statistics show that most iOS users prefer downloading free apps, and the fact that 93.9% of all iOS app downloads are free proves it. That leaves only 6.1% for paid-for downloads.
(Statista)
6. Zoom had over 93 million downloads in Q2 2021.
While most industries have a hard time recovering from COVID-19, apps seem to be flourishing. One such example is Zoom, with over 93.1 million downloads in the second quarter of 2021. The video conferencing platform was also one of the three apps with 300 million downloads in only one quarter in 2020.
(Sensor Tower, Sensor Tower)
7. Only 3.3% of Google Play downloads are paid for.
Android apps download statistics show that, just like iOS, Android users don’t particularly like paying for their apps. Only 3.1% of all Google Play Store downloads are paid-for, leaving the remaining 96.7% to free app downloads.
(Statista)
8. Google Play Store downloads grew by 31% in 2020.
Play Store boasts a 31% jump in downloads from 2019 to 2020. Simultaneously, the App Store has little to brag about, with a trifling 2.5% growth rate.
(BuildFire)
9. There are over 2.6 million apps on Google Play.
App download statistics show that the current number of Android apps on the Google Play Store is 2,668,543 at the moment. On the other hand, its competitor, Apple App Store, has 2.1 million apps available for download.
(AppBrain, Statista)
10. 18.7% of shopping app downloads between Q1 2019 and Q2 2020 happened in the period’s last quarter.
In 2019, four billion shopping apps were downloaded, but interestingly enough, 20.3% of the total ecommerce apps and 18.7% of shopping app downloads worldwide happened during the holiday season.
(Business of Apps)
11. 51% of US smartphone users don’t download apps.
Mobile app download stats show that more than 50% of US smartphone owners don’t download any apps on their phones. They tend to use the ones they already have but won’t install new ones.
(TechCrunch)
12. App stats confirm that more than 600 million app downloads happened every day in 2020.
The mobile app market recorded rapid growth in the past couple of years, along with the number of app development companies behind these products. Data shows that there were around 218 billion app downloads in 2020 alone. We did the math — divided by 12, the number of average app downloads per month stands at 18.1 billion, which means that 2020 saw 605 million downloads per day.
(Statista)
App Usage Statistics
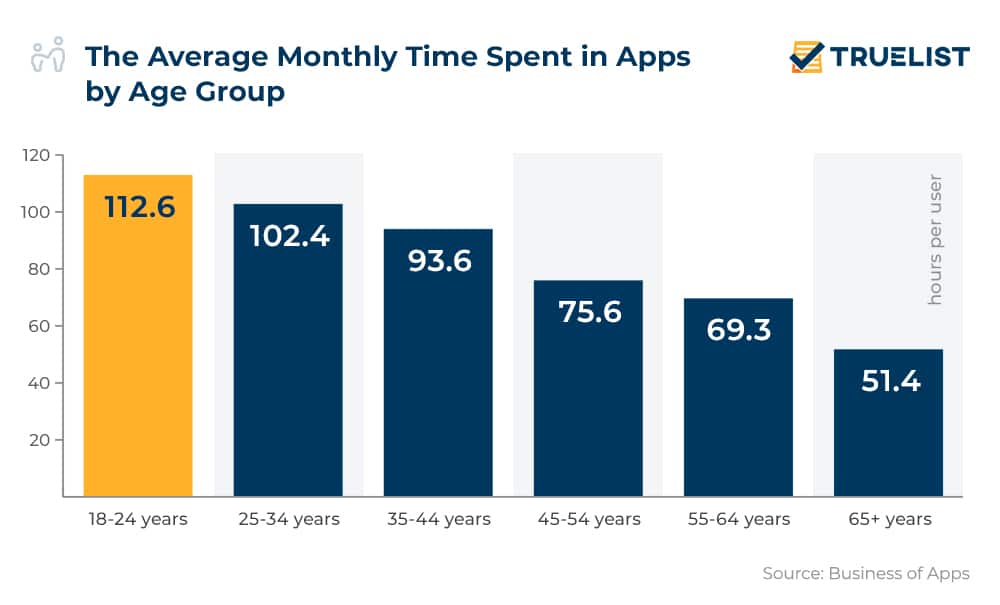
13. An average Gen Z user spends 112.6 hours using apps every month.
This stat may not surprise you, but app usage data shows that younger generations use apps the most every month. Gen Zers, currently accounting for 26% of the global population, use apps for 112.6 hours on a monthly basis, while users from 25 to 34 years old spend 102.4 hours using them every month. The 35-44 age group takes third place with an average of 93.6 hours of monthly app usage, while 45-54-year-olds use apps for 75.6 hours. App statistics show that the 55-64 age group uses apps for 69.3 hours, and last but not least, the 65+ age group is reported to be active on apps for 51.4 hours on a monthly basis.
(Business of Apps)
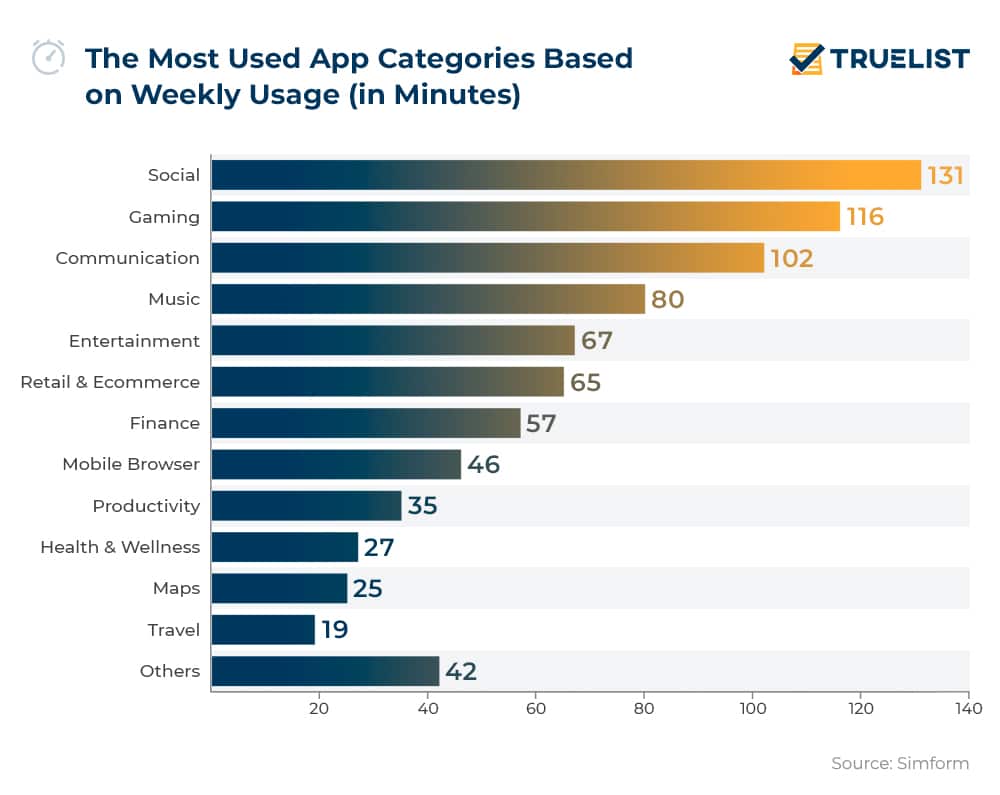
14. Users spend 131 minutes on social apps weekly.
One of the most popular app categories is social, as users are spending 131 minutes on those apps every week. Coming in second is gaming, a category that users spend 116 minutes on average. Mobile app usage statistics show that an average user will spend 80 minutes listening to music on their mobile apps and 67 minutes on other types of entertainment.
(Simform)
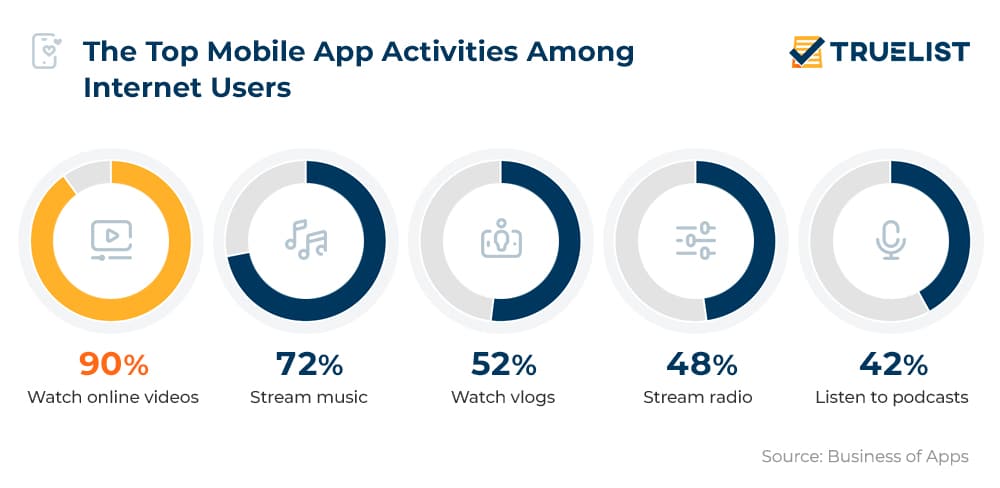
15. 90% of app users worldwide use their apps to watch online videos.
While video streaming seems to be the most popular app activity, 52% of users also watch vlogs on their apps. 72% of them stream music, while 48% of global users stream radio on their mobile apps. And finally, according to mobile app statistics, 42% of users listen to podcasts using their apps.
(Business of Apps)
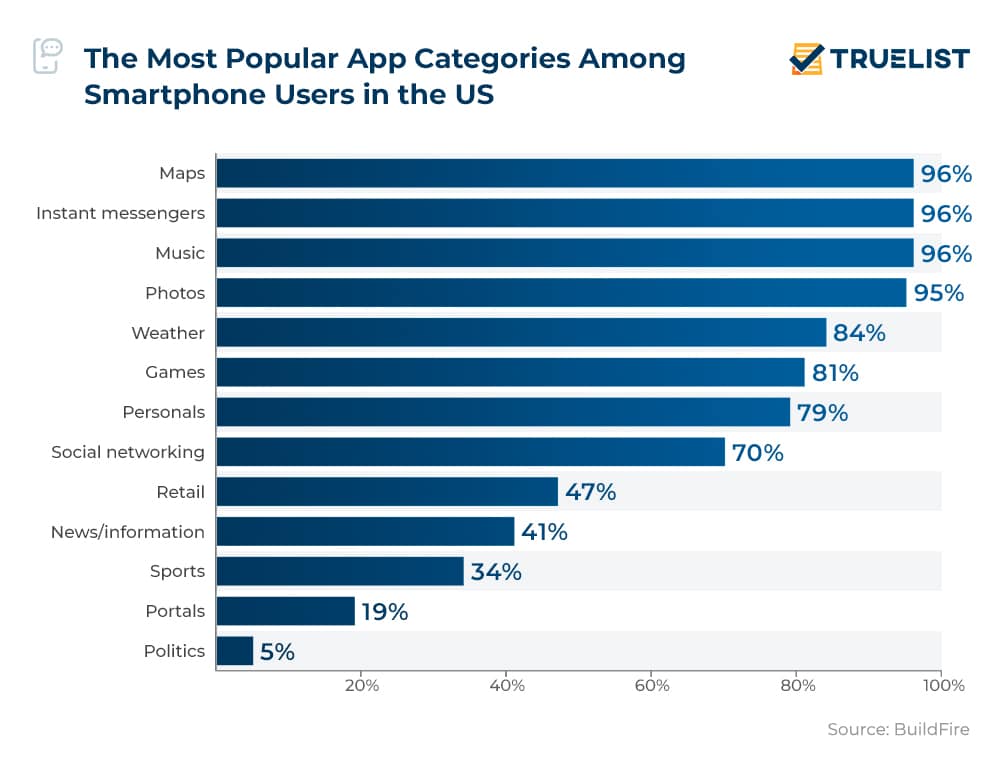
16. In the US, more than 95% of overall map usage comes from smartphones.
Maps are commonly used on smartphones, and the fact that 96% of the overall digital time in the US comes from them confirms it. It makes sense that smartphone owners use maps on the go, but mobile app usage data show that people in the US also access their music and instant messaging apps on their phones 96% of the time too.
(BuildFire)
17. 91% of users access their apps at home.
Statistics about mobile apps show that 91% of app users access their apps at home, while 72% use them at work and 63% while shopping. Interestingly enough, 83% of users are active on their apps while in the bathroom, and 78% while watching TV.
(Simform)
18. 41% of Gen Zers use their social media apps to fill their spare time.
According to mobile app demographics, more than 40% of Gen Zers say that they use their social media to fill spare moments, while 40% of them also use social media apps to find entertaining content, and 34% use them to check the news. Apps statistics show that only 33% say they use social media to stay in touch with their loved ones, and 31% of Gen Z share photos and videos on social media platforms.
(Business of Apps)
19. An average person has over 80 apps on their smartphone, app stats show.
This may come as a shock, but an average smartphone owner will have more than 80 apps installed on their phones. However, they will only use 30 apps every month and up to 9 apps daily.
(BuildFire)
20. 98.5% of people have Facebook installed on any kind of mobile device as of January 2022.
Mobile app stats show that over 98% of mobile users installed Facebook on their phones, regardless of operating systems. This stat comes as no surprise, as, after all, Facebook is the most downloaded app of the decade. Another thing about one of the most used mobile applications globally is that only 1.5% of people use the app only on their laptop or computer.
(Madison)
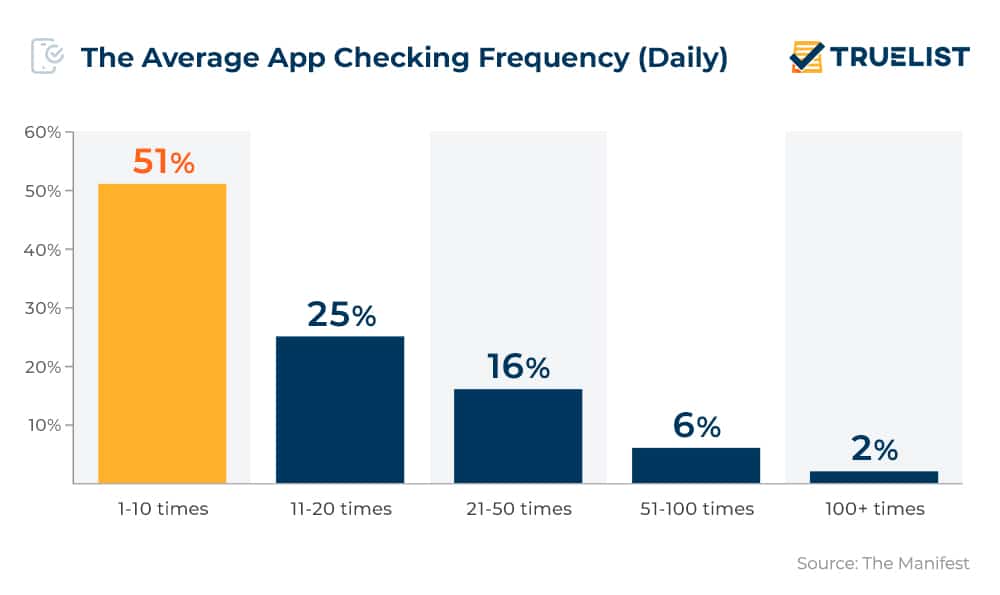
21. 32% of mobile users check their apps at least once a day.
App usage data shows that an average app user will check their apps from 1 to 10 times every day. Additionally, mobile app user statistics show that people spend 84% of their time online using only five apps that were not pre-installed on their phones when they got it.
(The Manifest, TechCrunch)
App Revenue Statistics
22. The mobile apps market is expected to generate over $930 billion by 2023.
Both app popularity and the number of iOS development companies behind those apps keep growing by the minute, which is why experts anticipate that the app market will generate up to $935.2 billion in revenue in the next two years.
(Statista)
23. Apple’s App Store revenue in Q1 2022 was 10.7 billion.
We already mentioned that app users prefer free apps over the ones they have to pay for. Apple App Store statistics, however, show that the tech giant managed to bring in 21.8 billion in revenue from paid app downloads, in-app purchases, and subscriptions. On the other hand, Google Play Store’s gross app revenue for Q1 2022 was $10.7 billion.
(Statista)
24. Gaming apps account for up to 80% of overall app revenue.
Compared to 2019, global app revenue had a 23.4% increase in Q1 2020. Out of $50.1 billion of the total revenue, $36.6 billion came from gaming apps. That means the overall mobile game spending had a 21.2% year-on-year increase, both on Google Play and App Store. Google Play had in-game spending growth of $14.4 billion, or 19%, while in-app purchase statistics show that the App Store games hit $22.2 billion, marking a 22.7% growth.
(Sensor Tower)
25. 91% of Google Play Store’s revenue is subscription-based.
It’s no secret that subscription-based apps are a gold mine, and Android developers know it. However, that doesn’t make the fact that more than 90% of the overall consumer spend on the Play Store comes from subscriptions any less surprising. Additionally, 97% of Apple’s App Store revenue also comes from subscriptions.
(MindSea)
26. PUBG Mobile brought in $2.6 billion in 2020.
Mobile apps market statistics show that PUBG Mobile is the top-grossing game at the moment. The game managed to earn $2.6 billion on both the App Store and Google Play. The second highest-grossing game is Honor of Kings, and it brought in around $2.5 billion worldwide. An interesting fact is that both games come from Tencent, a game publisher that generated more than $5 billion from their two top-grossing apps in revenue.
(SensorTower)
27. Globally, Google LLC was the leading non-gaming app publisher on Google Play worldwide in February 2022.
According to Statista’s app industry statistics, the top non-gaming app publisher in February 2022 was undoubtedly Google LLS, with roughly $109 million in app revenues. After Google LLC comes TikTok Pte. Ltd. with $86.06 million, along with Disney, with $46.03 in app revenues.
(Statista)
28. China generated $48 billion in app revenue in 2020.
In terms of app revenue generation, China took the lead in 2020 with over $48 billion. The US took second place with $32 billion, while Japan had $20 billion in app revenue. App revenue statistics show that the rest of the world generated $29 billion.
(Business of Apps)
29. Pokemon Go generated $1 billion in 2020 alone.
We all remember what a craze Pokemon Go was when it was just released, but it looks like the app popularity isn’t going anywhere anytime soon. The game has generated $4 billion in total revenue, with $1 billion in 2020 alone.
(Sensor Tower)
Dating App Statistics
30. Bumble has 100 million users worldwide.
Bumble is one of the most popular dating apps worldwide, and the fact that it has obtained 100 million users since its launch in 2014 proves it. Bumble’s revenue in 2017 amounted to $10 million but went up tenfold just the following year. In 2019, the dating app company had revenue of $240 million, and in 2020, that number climbed to $337 million.
(Business of Apps)
31. 72% of Bumble users are under 35.
Dating apps statistics show that most Bumble users are 35, making it a better choice for younger generations. In comparison, dating app demographics show that 60% of Tinder users are of the same age.
(Business of Apps, Business of Apps)
32. Roughly two-thirds of leading US dating apps’ users are male.
Dating apps are a lot more popular with men than women, with 67.4% of Bumble’s user base being male. The results are almost the same with Tinder, with 72% of its US userbase being male too.
(Statista, Business of Apps)
33. Badoo has over 460 million registered users.
Apps statistics show that the dating app market leader is reported to have 468 million registered users, while at least 60 million of them are monthly active users. However, even though the dating app seems to be the most popular, it is valued at only $3 billion, losing to Tinder’s $10 billion app valuation by a long shot.
(Business of Apps, Business of Apps)
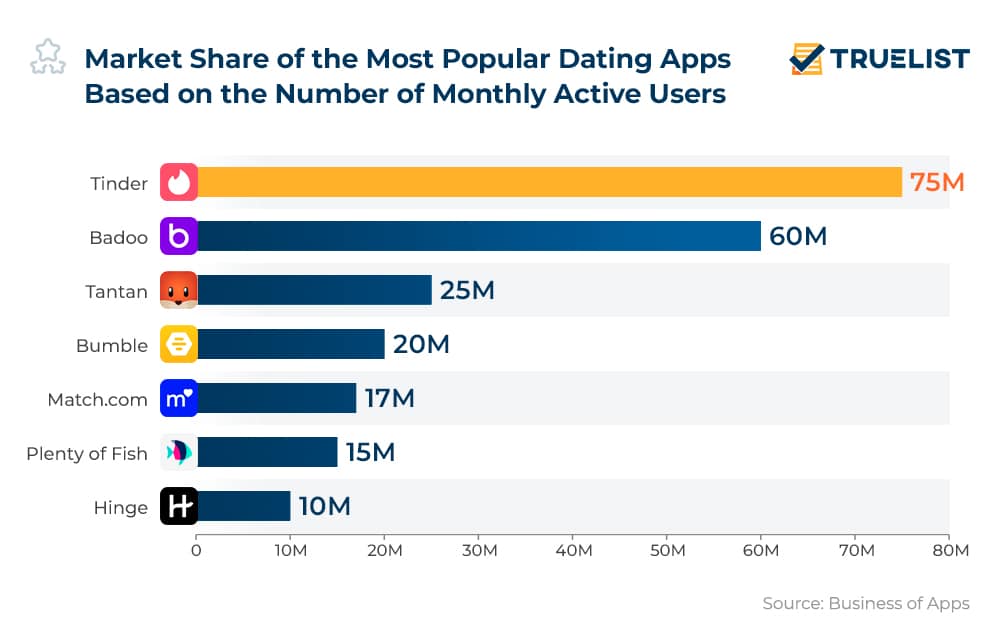
34. Tinder and Badoo are the two largest market leaders, with over 50 million monthly active users each.
Tinder is one of the best dating apps worldwide, especially if you keep in mind that it is the market leader with 75 million monthly active users. Badoo is in second place with 60 million, while Tantan takes the third spot with 25 million MAUs.
(Business of Apps)
Health and Fitness Apps Statistics
35. The global fitness app market should climb to $16 billion in the next five years.
The health and fitness app market size has been increasing over the years. Experts predict that it will reach $15.96 billion by the end of 2026. The market shows rapid growth due to the evolving consumer lifestyle and unhealthy habits and has also expanded due to the ongoing pandemic.
(GlobeNewswire)
36. More than 87 million US users are active in health and fitness apps.
Fitness apps statistics show that the number of fitness app users in the US was 87.4 million in 2020. The number includes those who have used at least one fitness or health app once a month. However, the user base will drop to 84 million in 2021 before reaching 86.3 million in 2022.
(Statista)
37. 41% of all fitness and health tracking device users are in the 30-39 age group.
A third of all app users are active on fitness apps, but the fitness app demographics show that only 26% of 15-19-year-olds use them to track their health. From there, we have a big jump, with 39% of 20-29-year-olds using the apps. Mobile app usage statistics show that 30-39-year-olds are the most active of all age groups, with 41% of them using health tracking devices, while only 28% of 40-49-year-olds do the same. As far as 50-59-year-olds go, 25% of them track their health and fitness using apps. And finally, the demographics of fitness app users show that 21% of the 60+ age group use the apps as well.
(Statista)
![]()
38. MyFitnessPal earned almost $9 million in revenue in March 2022, according to app statistics.
MyFitnessPal is one of the best health and fitness apps at the moment. It was the market leader in March 2022 with $8.977 million in revenue, closely followed by Strava and its $5.6 million in revenue. Data also shows that the third market leader is Fitbit, a fitness and health app with $4.18 million in revenue.
(Statista)
Mobile Banking Apps Statistics
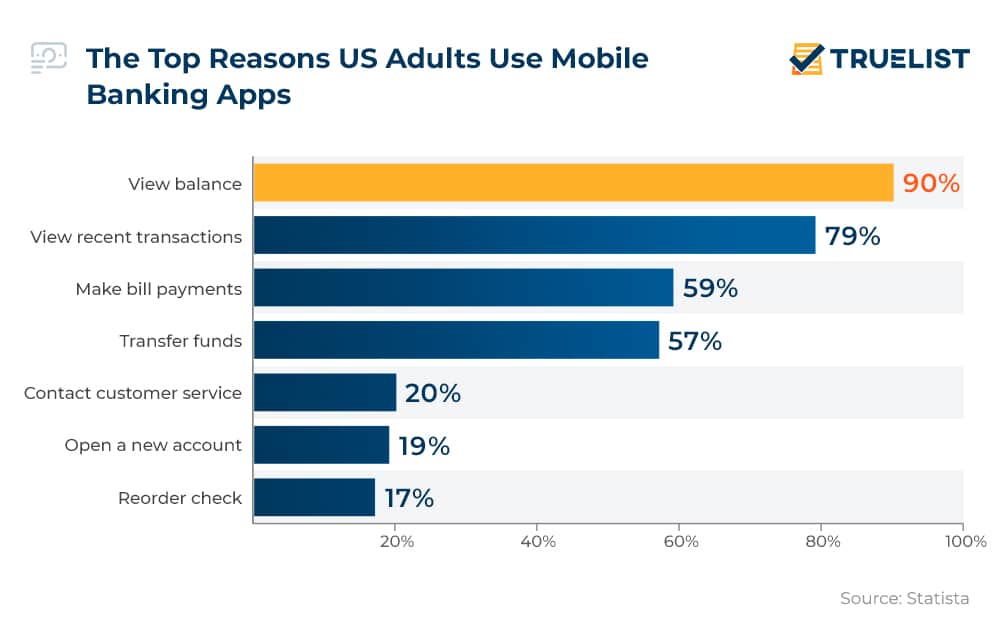
39. 90% of US app users use mobile banking to view their balance.
The main reason 90% of US citizens use mobile banking on their phones is to view balance. Just under 80% (79%) noted they also use banking apps to view recent transactions, while 59% use them to pay their bills. 57% say they use mobile banking apps to transfer funds, and 20% said they needed them to contact customer service. 19% of US citizens used mobile banking apps to open a new account. Finally, mobile banking usage statistics show that 17% use a banking app to reorder checks.
(Statista)
40. There are around 2 billion mobile banking app users.
Mobile app statistics from a report by Juniper Research reveal that there are approximately 2 billion mobile banking users worldwide. Considering the latest mobile marketing stats that put the number of mobile users at 7.1 billion globally, it’s safe to say that the mobile banking app user base will only keep growing.
(Retail Dive)
On-Demand App Statistics
41. US consumers spend $57.6 billion in the on-demand economy annually.
The US on-demand economy caters to 22.4 million users every year. The market sees an average user spend of just under $58 billion annually.
(Techtic)
42. The US online marketplace brings in $35.5 billion every year.
The US online marketplace is the most lucrative market of all on-demand services. Transportation brings in about $5.6 billion on average, while food and grocery delivery accounts for $4.6 billion in revenue each year. On-demand economy statistics show that all other miscellaneous services and categories in the US account for $11.9 billion annually.
(Harvard Business Review)
43. 42% of US adults have used on-demand services.
86.5 million US consumers say they used on-demand services at least once in their lifetime, while 45 million US adults said they had offered services in the on-demand market. Additionally, 51% of people who offered their services said that their financial situation had improved since.
(JungleWorks)
44. On-demand business apps had more than 62 million downloads in just one week.
App store download statistics show that during the week of March 14-21, 2020, there was major on-demand apps growth, with more than 62 million downloads on both the App Store and Play Store in just one week. Most users were downloading Zoom, Hangouts Meet, Houseparty, and Microsoft Team that week.
(App Annie)
45. 2020 saw a 90% growth in the on-demand economy market size compared to the year before.
The global pandemic slowed down most industries, but the on-demand app market was not one of them. According to some statistics about mobile apps, in 2020, the business apps market saw a 90% jump compared to average weekly downloads in 2019. Experts say that the on-demand mobile apps market size is expected to grow even more.
(App Annie)
46. The on-demand mobile app market is projected to reach over $330 billion by 2025.
The on-demand market has been experiencing major growth throughout the years, but experts predict that it will reach a value of $335 billion by the end of 2025. Data further shows that 23 out of 310 private-owned companies worth at least $1 billion come from the on-demand sector.
(Appinventiv)
Retail Mobile App Statistics
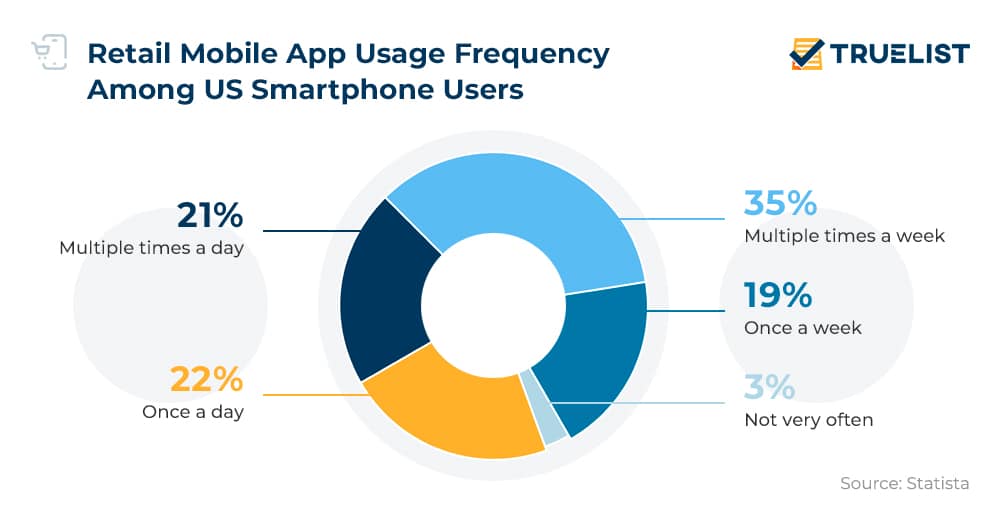
47. 22% of US consumers use retail store apps once a day.
While nearly a quarter of US online shoppers use retail apps once a day, 21% turn to them several times a day. 19% said they use them once a week, while 35% of shoppers use them several times per week. Finally, 3% of US consumers said that they rarely use retail apps.
(Statista)
48. 35% of US shoppers only use their mobile devices when shopping online.
App sales statistics show that more than a third of US online shoppers only use their phones or tablets when shopping. The stats also show that mobile shoppers tend to spend up to twice as much as regular shoppers.
(BuildFire)
49. The pandemic caused a 109% increase in retail apps downloads.
An immense retail mobile app growth took place in Q2 2020. Due to the pandemic and the first lockdown, retail apps were used extensively, creating a shocking 109% increase in retail app downloads.
(JMango360)
50. Retail in-app revenue increased by 45% YoY.
Apps stats show that from September 2019 to September 2020, retailers saw a 45% in-app revenue increase. The biggest revenue surge occurred during the lockdown in Q2 2020 when revenue grew by 44% compared to Q1 2020.
(JMango360)
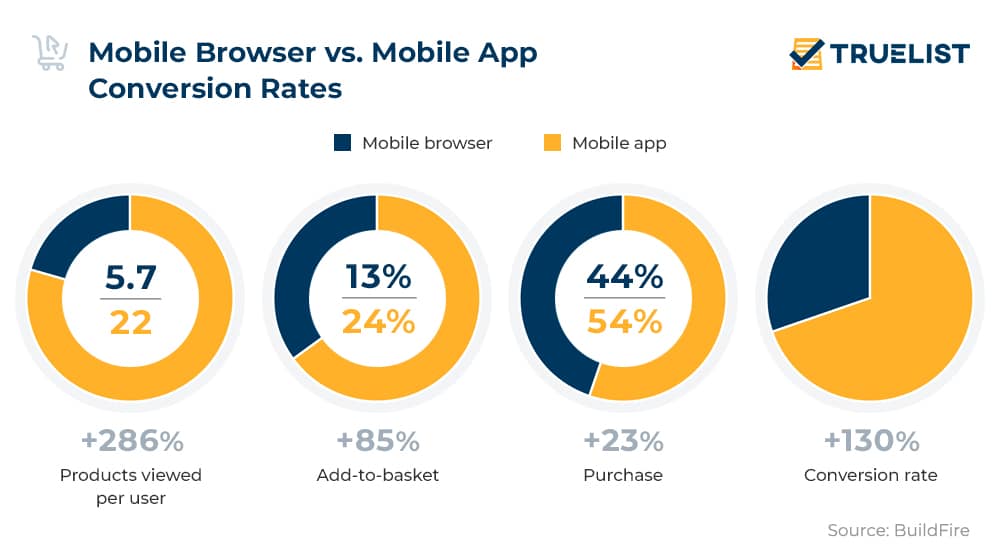
51. Conversions are 130% higher on retail apps than retail websites.
Global retail conversion statistics show that mobile browsers are ineffective when compared to mobile apps. An average user will view 5.7 products on a browser but 22 on an app. Only 13% of online shoppers will add a product to the cart when using a browser, while 24% will add it to their cart using an app. Finally, retail mobile app stats show that 44% of users will end up making a purchase on browsers, while 54% will use a retail app.
(BuildFire)
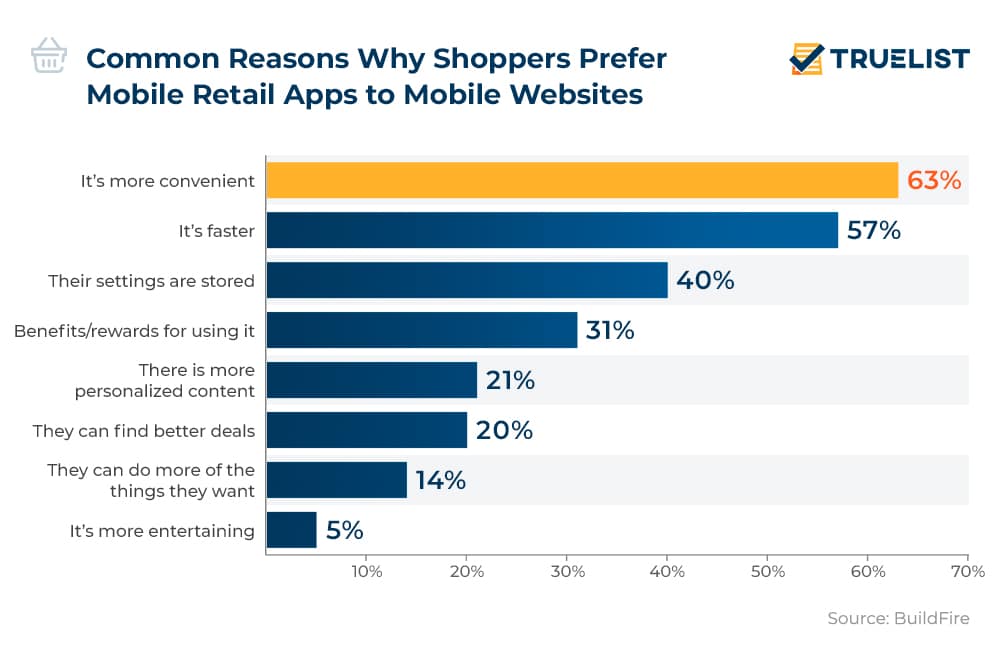
52. 63% of online shoppers say that retail mobile apps are more convenient than websites.
Most users agree that retail mobile apps are superior to mobile sites. 63% of users like apps better because they think they are convenient, 57% say that they are faster, and 40% like them because they can store their settings. 31% of online shoppers prefer retail apps because they sometimes get rewards or benefits for using them, while 21% enjoy personalized content. 20% think that apps help them find better deals.
(BuildFire)
Mobile Shopping Statistics
53. 72.9% of total e-commerce sales are expected to be generated via m-commerce in 2021.
Experts predict that almost 73% of all online sales will be generated by mobile retail commerce this year. This is an increase of 23.7% compared to 2017, when m-commerce generated 58.9% of all retail e-commerce.
(Statista)
54. The majority of consumers use a phone while inside the store to look up product reviews.
Up to 80% of shoppers will use their smartphones while they’re already inside of a physical store to compare prices, find alternative store locations, or just look up product reviews, according to apps stats.
(OuterBox Design)
55. The average order value from a mobile website is $92 compared to $102 from a mobile app.
Mobile shopping apps have proven more lucrative than mobile websites. The $10 difference per average order value shows that mobile shopping apps are the future of online shopping.
(BuildFire)
56. Shopping cart abandonment from mobile apps is only 20%.
According to app sales statistics, only 20% of shopping carts end up abandoned on mobile apps. By comparison, the shopping cart abandonment rate for mobile sites is 97%, with slow-loading websites further increasing the abandonment rate by 75%. The reason for this is that mobile apps allow their users to store their customer information on their profiles. This means that they don’t have to enter the same details every time they want to make a purchase, as opposed to mobile websites that don’t store their information.
(BuildFire)
App Statistics by Country
57. 81.9% of US users report using YouTube at least once a month.
Almost 82% of internet users aged 16 to 64 say that they use YouTube on a monthly basis, while 73.4% of them said that they used Facebook as well. The third most popular social media platform in the US is Instagram, with 56.6% of monthly active users. It is closely followed by Facebook Messenger with 55.7% MAUs. Finally, Twitter takes the fifth spot with 43.2% of monthly active users.
(We Are Social)
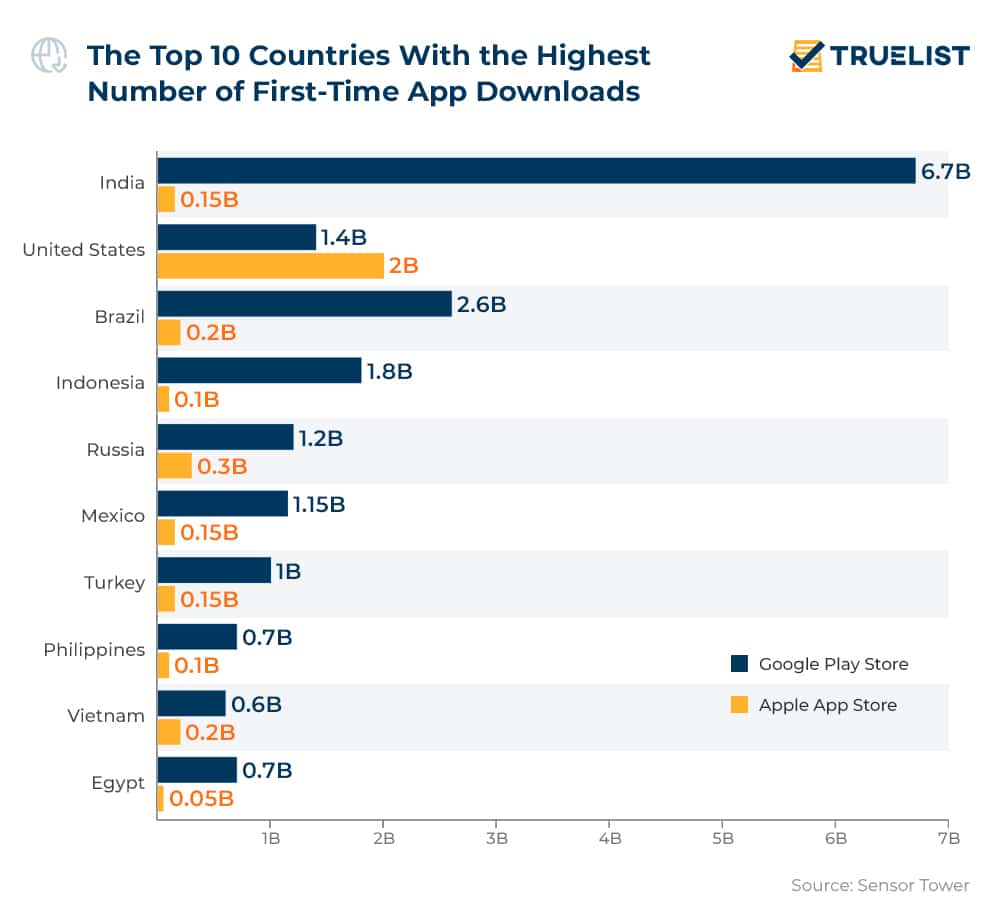
58. India approached 7 billion first-time downloads in Q1 2021.
According to app usage statistics, India is the country with the biggest number of new app installs with over 6.8 downloads. The US takes second place in worldwide app downloads with 3.4 billion new installs in Q1 2021, followed by Brazil, with roughly 2.8 billion first-time app downloads.
(Sensor Tower)
59. WhatsApp is still the UK’s favorite messenger service, with more than 81% of active users.
WhatsApp, one of the most popular messaging apps in the world, is still the market leader in Great Britain. According to app usage statistics, UK users’ second favorite messenger service is Facebook Messenger, with 75% of MAUs. Finally, Snapchat comes in third, with only 25% of active users in the UK.
(Messenger People)
60. Google Play Store had 6.9 billion downloads in India in Q2 2020.
Google Play dominates the Indian app market. It had almost 7 billion downloads last year, while the Apple App Store had fewer than 300 million. However, iOS app statistics show that the App Store is still the market leader in the US. It had over 2.2 billion downloads in 2020, while Google Play Store had just over 1.5 billion app downloads.
(Sensor Tower)
61. The Apple App Store has over 55% controlling share in Japan.
While Google’s Play Store controls the market in most countries worldwide, the Apple App Store has loyal customers in the US and Japan. App download statistics by country show that Apple had up to 60% of Japan’s overall app downloads in 2020.
(Sensor Tower)
App FAQs
What is the #1 app in the world?
Instagram is currently the market leader in the app industry. Meanwhile, if we look at the number of downloads, TikTok seems to be overtaking the social media giant’s title of the world’s number one app.
(Forbes)
How many apps does the average person have?
An average mobile device user has 40 apps installed on their devices but uses only less than that on a monthly basis.
(Simform)
What are the most popular apps?
The most popular apps in the world are Zoom, WhatsApp, Facebook, Facebook Messenger, Instagram, Google Meet, TikTok, and YouTube.
(Forbes)
Which app has the most users?
According to mobile app statistics, WhatsApp is currently the app with the most users (and downloads).
(Sagippl)
What apps do millennials use?
Leading apps with the highest concentration of millennials are Facebook, Venmo, Tinder, Airbnb, Snapchat, Mint, and Kik Messenger.
(Koombea)
What age group uses apps the most?
Users between the ages of 25-34 spend the most time using apps, at least in the US.
(Comstore)
What percentage of apps are free?
The percentage of free iOS apps is 93% and 96% for Google Play Store apps.
(Statista)
How many apps are successful?
Less than 0.5% of all mobile apps become financially successful.
(Fyresite)
Which game is most downloaded in the world?
Garena Free Fire is one of the most popular games in the world, and it has been downloaded 10 billion times in 2022. It beats its competition in the number of downloads of an app to this day.
(Sports Unfold)
How many mobile apps exist?
App statistics confirm that there are 8.9 million mobile apps across major app stores.
(Forbes)
What is the #1 dating app?
Tinder is currently the most popular dating app.
(Statista)
Are fitness apps profitable?
While many fitness apps don’t make any money from in-app purchases, the other half does make revenue.
(Auxano Global Services)
How big is the fitness app market?
The fitness app market has reached $1.3 billion in 2022.
(Grand View Research)
What is the number 1 fitness app?
Data shows that MyFitnessPal is the leading fitness app at the moment.
(Statista)
How often do mobile banking customers use their app?
97% of mobile banking customers use mobile banking, according to apps statistics.
(StoryLy)
What percentage of mobile phone owners use mobile banking?
70% of smartphone owners use some type of mobile financial service.
(Retail Dive)
Where is mobile banking most popular?
Global mobile banking usage is the highest in India.
(Sensor Tower)
What banking activity do most consumers use mobile banking for?
94% of mobile banking app users say that they use the apps to check their balance.
(Flex Cutech)
Wrap-Up
The mobile app industry growth will continue to increase over the coming years. Apps statistics confirm the immense importance of app usage and online presence across all industries, from dating to finance, further suggesting that app design agencies will continue to thrive and generate healthy revenue despite the ongoing pandemic.
Sources: Business of Apps, Sensor Tower, TechCrunch, We Are Social, SensorTower, Statista, Retail Dive, Statista, Apptopia, Statista, Statista, Sensor Tower, Sensor Tower, BuildFire, AppBrain, Statista, Simform, Madison, The Manifest, TechCrunch, Statista, Statista, Sensor Tower, MindSea, Statista, Sensor Tower, Business of Apps, Business of Apps, Statista, Business of Apps, GlobeNewswire, Statista, Statista, Statista, Techtic, Harvard Business Review, JungleWorks, App Annie, Appinventiv, Statista, BuildFire, JMango360, Statista, OuterBox Design, Messenger People, Forbes, Sagippl, Koombea, Comstore, Statista, Statista, Fyresite, Sports Unfold, Forbes, Statista, Auxano Global Services, Grand View Research, StoryLy, Retail Dive, Flex Cutech