Launched in 2006, Twitter quickly became a household name. Today, one billion tweets are posted in less than two days, and virtually every corner of life is talked about on Twitter. The platform’s prominence has been reaffirmed amid the coronavirus pandemic that forced people to the digital world. That’s why we made a list of key Twitter statistics for those who’d like to get to know this platform better.
Twitter Statistics (Editor’s Choice)
- Users post 9,596 tweets per second on average. (Internet Live Stats, GDelt Project)
- Twitter is the fourth most visited website globally. (Ahrefs)
- There are 229 million active users on Twitter and counting. (Statista)
- A Republican typically receives 14 more retweets than a Democrat. (Fortune)
- Trending topics usually stay on the list for 11 minutes. (GetDayTrends, arXiv, Jungle Marketing)
- Twitter’s total advertising revenue increased by 23% in 2022. (WSJ)
- The engagement rate of Twitter ads can go from 1% to 3%. (Word Stream)
Twitter Usage Statistics and Demographics
1. Users send out an average of 9,596 tweets per second.
That equals 575,760 tweets per minute, 34,545,600 tweets per hour, and 829,094,400 tweets per day. You get the gist. Twitter notoriously peaked in 2013 in terms of traffic and had been steadily declining until the pandemic broke out. The surge towards the platform intensified between March 12 and March 30, 2020, as Twitter traffic stats show. Astonishingly, the high levels remained stable for months to come, pointing to the importance of the platform in keeping societal conservation going in the absence of physical gatherings.
(Internet Live Stats, GDelt Project)
2. Twitter is the fifth most visited website worldwide.
Twitter holds its ground within the top five websites, with 285 million visits per month. The difference among its competitors, YouTube, Facebook, and Wikipedia, is quite significant, though. Wikipedia receives more than 1,1 billion visits per month, trailing behind Facebook’s 467 million, and YouTube scores nearly 935 million monthly visits. Twitter traffic statistics further show that 285 million of the total number of Twitter visits come from organic sources.
(Ahrefs)
3. An average US-based user spends 6 minutes a day on Twitter.
Amid the nationwide lockdowns, US adults added one hour a day to their daily digital media consumption, spending 7 hours and 57 minutes on digital platforms. Twitter usage stats show that the platform accounts for only a tiny portion of that. Facebook dominates when it comes to social platforms: a US adult is likely to spend 22 minutes on Facebook, while Instagram gets 11 minutes.
(eMarketer)
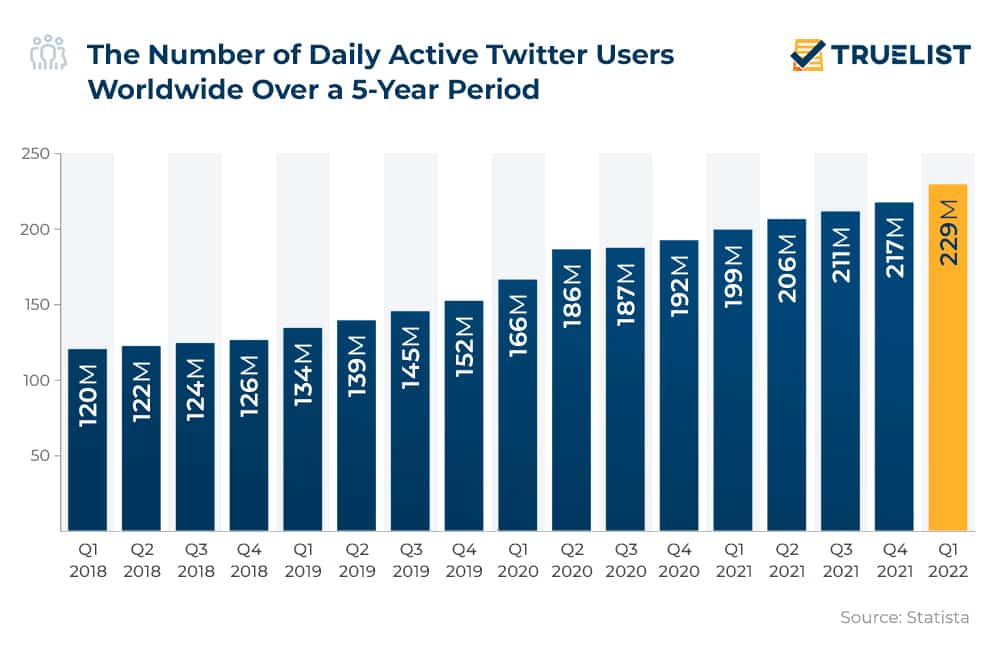
4. There are 229 million active users on Twitter.
The number of monetizable daily active usage (as Twitter likes to put it for investors) has nearly doubled between 2017 and 2022. Twitter statistics by year show that the platform’s mDAUs are increasing steadily, reaching the 200-million mark for the first time in the second quarter of 2021. There’s still a long way to catch Instagram’s eye-watering +900 million reach.
(Statista)
5. Only half of US users visit Twitter daily.
The majority, 96%, to be precise, reported that they visit the platform monthly, while 84% claimed they check in to see what’s going on once a week. It is interesting that only half of the Twitter user count is active daily; are they doing all the talking?
(Statista)
6. 80% of tweets come from 10% of active Twitter users in the US.
Not quite. Very, very small groups do all the talking. The remaining 90% are only responsible for 20% of daily tweets. In fact, Twitter user statistics show that the average Twitter user is not that active. The average number of Twitter followers for a median user is 25, following 84 people, posting twice, and favoriting one tweet per month.
(Pew Research)
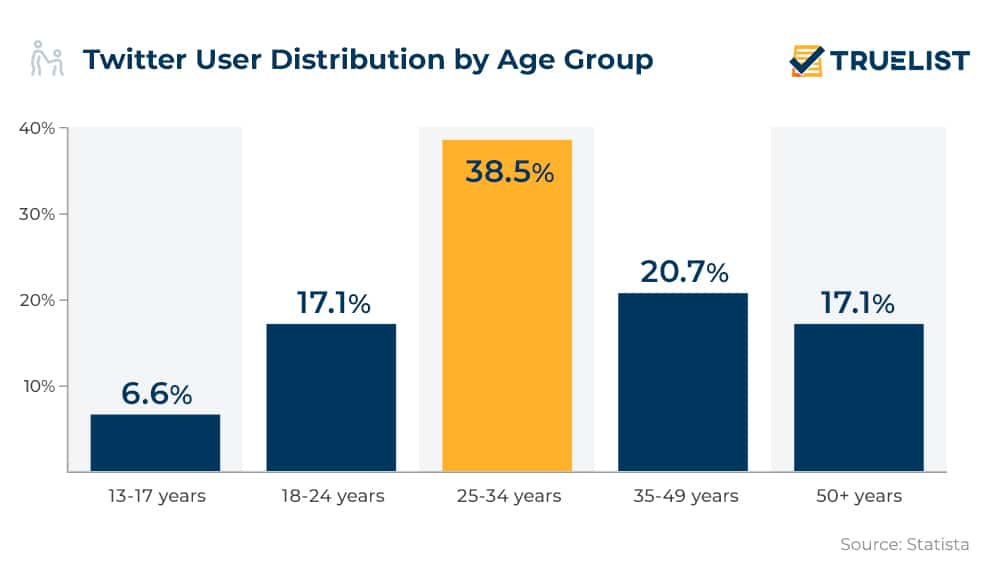
7. The majority (38.5%) of Twitter users are aged 25-34.
Users aged between 35 and 49 make up 20.7% of the total number, while ages 18 to 24 make up 17.1% of Twitter’s audience. The same percentage of the Twitterverse is 50 or older, as evidenced by the latest stats on Twitter demographics.
(Statista)
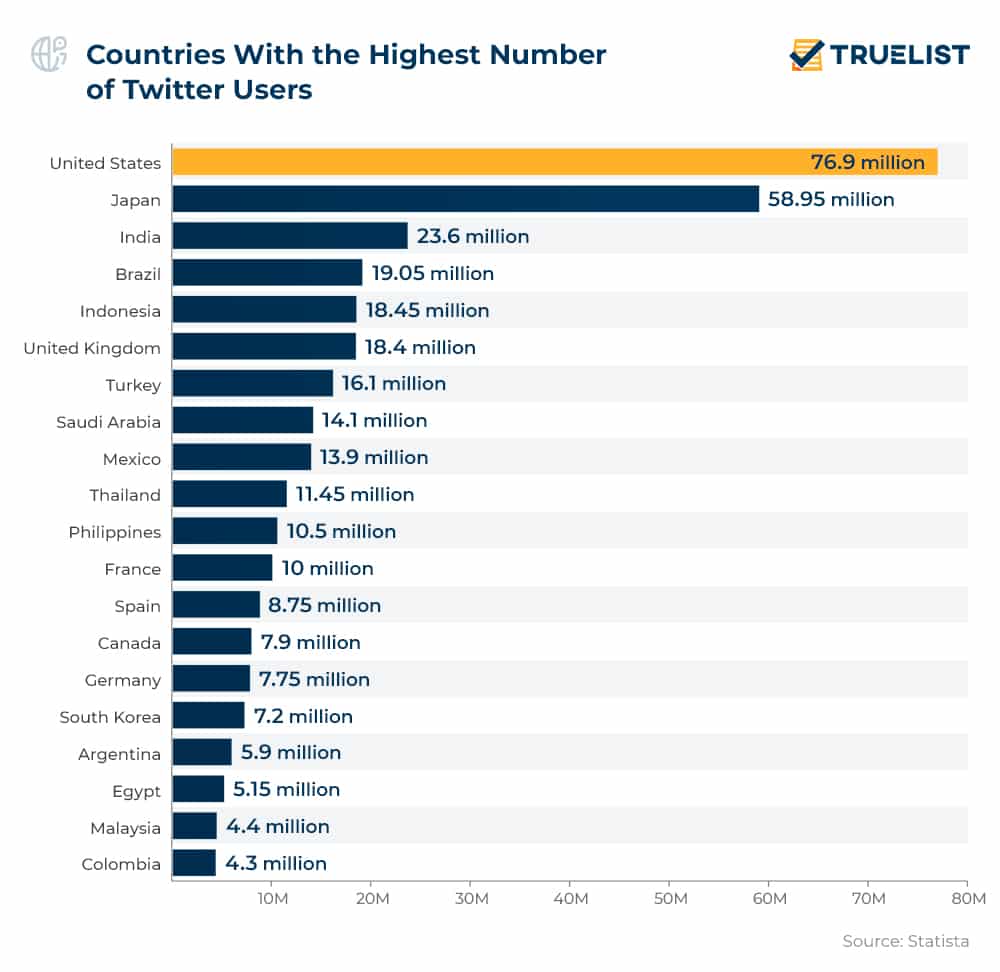
8. The US has the largest number of Twitter users. (76.9 million)
Seventy-three million Twitter accounts are US-based; Japan, India, and the UK follow after. The US is also home to the majority of top 10 Twitter accounts with the most followers, including former president Barack Obama.
(Statista)
9. 68.5% of Twitter’s audience is male.
There’s a little problem with the data on the Twitter gender demographics, though: it was discovered that the platform has been associating auto-generated genders to users based on their activity to deliver more suitable advertisements. Unsurprisingly, the algorithm has misgendered users quite often. More on Twitter trivia about gender, women make up most (65%) of the 10% of active Twitter accounts, which carry out 80% of the conversation.
(DataReportal, Input Mag, Pew Research)
10. 42% of US adult Twitter users have at least a college degree.
31% of the total US population has at least a college degree. Twitter audience demographics show that the platform’s users tend to be more educated and wealthier. 32% of all American adults make at least $75,000 a year, compared to 41% of all platform’s adult users.
(Pew Research)
11. A typical Republican receives 14 more retweets than a Democrat.
When it comes to political figures on Twitter, Democrats appear as the dominant group compared to Republicans. Yet, Republican congress members enjoy a lot more interaction and engagement than their Democrat counterparts.
(Fortune)
Trends and Interesting Facts About Twitter
12. #BlackLivesMatter was the second most-tweeted hashtag in 2020.
The most-tweeted hashtag of 2020 was #COVID19, but that shouldn’t come as a surprise. Besides exchanging banana bread recipes, Twitter has also become a prominent and relevant platform for discussing social issues. The number of tweets containing the #BlackLivesMatter hashtag almost doubled since its use peaked in 2016, following the Dallas protests against police brutality, Twitter hashtag stats show. George Floyd further became the third most-tweeted-about person.
(Twitter)
13. As of April 2021, more than 20 incidents of permanent suspension had taken place.
The most notable of those is that of former president Donald Trump. He had been temporarily banned from the platform several times before, most famously for suggesting that bleach can cure coronavirus. His account got permanently suspended following the Capitol riots on the grounds of using this platform to incite violence. The platform took significant steps to combat disinformation and provide a safe space for everyone, specifically regarding COVID-19 and the presidential elections that took place later in the year, by introducing several new regulations. Subsequently, Twitter stats demonstrated a growing number of suspended accounts due to hate speech and spreading false news.
(Wikipedia)
14. False news stories are 70% more likely to be retweeted than factual ones.
A study conducted by three MIT scholars found that fake news can reach up to 1,500 users six times faster than accurate news. This is probably due to the captivating framing of false stories that tempt users to pass them on without much thinking.
(MIT News)
15. There has been a 64% increase in conversations about boredom.
Twitter trending statistics confirm the relevancy of the platform in expressing people’s disorientation while getting used to life under lockdown. While tweets about boredom saw a significant increase, posts including cooking or food almost tripled. Tweets about TV and movies have also seen a steep increase, recording 7,000 tweets per minute.
(Twitter)
16. About half of the total number of Twitter users who wanted the US to reopen were bots, according to Twitter user stats.
As the lockdowns intensified around May 2020, a wave of denial and campaign against quarantine measures began with it. A group of cybersecurity researchers analyzed 200 million tweets, which revealed that roughly 45% to 60% of tweets calling for lifting coronavirus measures came from bots, also known as automated user accounts that mimic human interactions on Twitter.
(MarketWatch)
17. The shelf-life of trending topics is usually 11 minutes.
Obviously, this could go way up: #gfvip, a hashtag dedicated to the Italian version of Big Brother, has stayed at the top for 58 days — the longest duration record of 2020, Twitter trends stats show. But what is needed to get a topic trending? While there isn’t a concrete number, on average, a topic needs more than 112,000 tweets to reach the top 10 and more than 236,000 tweets to get to the first row.
(GetDayTrends, arXiv, Jungle Marketing)
18. Stats about Twitter show that the energy needed to send a tweet emits .02 grams of CO2.
Our beloved platform emits more than ten metric tons of CO2 to the atmosphere per day. Former Twitter employees David Bellona and Tash Wong built a fun calculator, Tweet Farts, to see the carbon footprints of any hashtag. The delicate naming comes from their argument that each human fart emits the same amount of CO2 as sending a tweet. There you go, use it wisely.
(Tweet Farts)
Twitter Statistics for Businesses
19. About four in five B2B marketers (82%) use Twitter for organic content distribution.
While the platform has lost its edge to Instagram and Facebook, a significant number of marketers from top digital marketing companies still believe in its potential in terms of organic reach. The microblogging platform allows for a unique form of communication for brands, requiring less commitment than blogging but resulting in a similar effect. We can’t say the same about Twitter ads, though. Only 27% of marketers said they had used Twitter ads in the past 12 months, Twitter advertising statistics show.
(Content Marketing Institute)
20. Promoted trends can cost up to $200,000 a day.
While they ensure a massive reach, promoted trends are not for everyone. On the bright side, there are numerous more budget-friendly advertising opportunities on Twitter. Promoted ads cost somewhere between $0.50 and $2 per billable action. You can also promote your account for more followers or as a part of the product launch, which would cost $2 to $4 per follower.
(Rialto Marketing)
21. The engagement rate for Twitter ads can be as high as 1% and up to 3%.
This marks a greater success than Facebook’s average 0.119% click-through rate. Yet, with its freshly raised prices, cost per impression can go up to $3.50 now, compared to Facebook’s modest $0.59, according to Twitter marketing statistics. Facebook also has revenue per visitor twice as high at $0.93, against Twitter’s $0.44. That being said, Twitter has recorded a 300% YoY increase in its RVP, while Facebook only improved by 39%.
(Word Stream)
22. Twitter’s total ad revenue rose by 23%.
Despite the documented lack of popularity of Twitter ads across marketers, Twitter revealed that their ad revenue had grown by 23% in 2022. To be more precise, the overall advertising revenue amounts to $1.11 billion this year. What’s more, Twitter use statistics suggest that advertisers have used Twitter to raise brand awareness along with big events and sports.
(WSJ)
23. Tweets with hashtags receive twice as much engagement.
Adding a hashtag to your tweet transfers the tweet to the given hashtag’s feed and inevitably increases visibility and engagement. There is a limit to it, though. With more than two hashtags, tweets show a 17% drop in engagement rate, as shown by Twitter hashtags statistics.
(Buffer)
Twitter Statistics FAQ
How many people use Twitter?
Twitter has 229 million active users as of Q1 2022.
(Statista)
How many tweets are there?
There isn’t a definite answer to this question, but users are estimated to send roughly 6,000 tweets per second on average.
(Dsayce)
How many followers does the average Twitter user have?
Twitter followers statistics show that an average Twitter number of followers is 707.
(BrandWatch)
How many downloads does Twitter have?
Although there’s no data for 2022, it’s known that Twitter had 11.7 million downloads from the App Store in Q1 2019 and it was the sixteenth most downloaded app.
(Sensor Tower)
Wrapping Up
Looking closely at the Twitter statistics at hand, it is undeniable that the platform is enjoying a period of revitalization. While its growth is not world-shattering, it has surpassed the predictions at times. The platform has positioned itself as a promising tool for marketing purposes.
Sources: Sweor, Tandfonline, WebFX, Blue Corona, Intechnic, FinancesOnline, PR Newswire, Hongkiat, IBISWorld, Daxx, Sitejet, Glassdoor, Payscale, Salary.com, ZipRecruiter, GlobalWebIndex, Muck Rack, Think With Google, Website Builder Expert, Medium, Think with Google, Statista, Rebrandly, Statista, Elementor, Brain Station, Elementor, Freshbooks, Media Temple, Specky Boy