As 92% of people nowadays own mobile phones, and these gadgets are almost always in our hands, sending and receiving text messages is now easier than ever before. Since you don’t need an app for it and it doesn’t require an internet connection, texting continues to hold its own as a communication channel despite fierce competition from the likes of Messenger and WhatsApp. Texting statistics further reveal that this short message service is a great promotion tool for businesses, and that’s also one of the many reasons why we’ve prepared a list of stats and facts that you might find useful.
Texting Statistics (Editor’s Choice)
- 98% of adults in the US have a mobile phone. (SMS Comparison)
- Five billion people worldwide send and receive text messages. (Slicktext)
- 90% of customers prefer text messages over phone calls. (SMS Comparison)
- Text messages have only a 2.8% spam rate. (CTIA)
- With over 1 billion, China has the most SMS users in the world. (Slicktext)
Some General Text Messaging Statistics
1. 98% of US adults own a cell phone.
It is hardly surprising that in 2022, the vast majority of the US population owns some kind of phone which supports texting. Data further shows that there are about 272 million smartphone users stateside, further underscoring the widespread adoption of mobile technologies.
(SMS Comparison)
2. 98% of all text messages get opened.
Statistics have shown that almost 100% of people open their text messages. That’s mostly because mobile texting uses push notifications as a default setting, making it easier for recipients to see the messages immediately. In contrast, only 20% of people open their emails because they need to log in and go through their inbox, texting vs email statistics show.
(Mobile Monkey)
3. Text messaging is still the most used form of mobile phone messaging.
As many as 63% of users worldwide rely on the default texting app on their cell phones. The remainder of the texting market is split between the most popular messaging apps such as Facebook Messenger, WhatsApp, etc.
(Marketer Hire)
4. 95% of text messages are read and responded to in less than five minutes.
We’ve become so attached to our mobile phones that they are always in our hands or very nearby. That’s the reason why it should not come as a surprise that the average text response time is three minutes of delivery, text messages statistics reveal, boding well for SMS click-through rates.
(SMS Comparison)
5. Five billion people around the world send and receive text messages.
The way people and brands use texting has significantly changed over the past 10 years. Out of all forms of communication nowadays, SMS messages have the highest click and open rates and that’s the reason why a whopping 65% of the world’s population sends and receives messages, as evidenced by texting stats.
(Slicktext)
6. 5.9 billion people are expected to be able to send and receive text messages by 2025.
Texting isn’t slowing down anytime soon and nearly six billion people around the world will have access to SMS technology by the year 2025. This means that texting is and will remain one of the most used communication channels. Stats further show that by the same year, smartphone users will have reached 77% of the global population.
(Slicktext)
7. Texting vs phone calls statistics show that 90% of customers prefer text messages over phone calls.
For as long as people need quick and easy communication, text messages will always come in handy. Marketing aside, over 50% of consumers choose texting as their preferred form of communication over phone calls with customer support.
(SMS Comparison)
8. Consumers have more trust in text messages than in emails.
According to a recent study conducted by CTIA, 93% of the participants have more trust in text messages than in emails. That’s because text messages have only a 2.8% spam rate which is significantly lower compared to emails with a 53% spam rate.
(CTIA)
Business Texting Statistics
9. Businesses sent a total of 2.7 trillion text messages in 2020.
This marks a 10% rise compared to the 2.5 trillion sent in the prior year. It seems that the pandemic has not dampened businesses’ enthusiasm for text messages, but rather, has led to an increase in the number of messages sent to customers. This also coincides with the rise in popularity of text message marketing software which streamlines the process of contacting existing and prospective customers by means of SMS.
(Juniper Research)
10. Business texting statistics indicate that 62% of consumers have subscribed to get texts from at least one business.
Texting is still a very popular tool of communication and should be exploited as an efficient marketing channel. SimpleTexting’s 2021 survey performed on more than 1,300 US-based consumers, marketers, and business owners further found that 57% of business owners were planning to increase their spending on text marketing.
(SimpleTexting)
11. 48% of customers prefer direct communication from businesses through text messages.
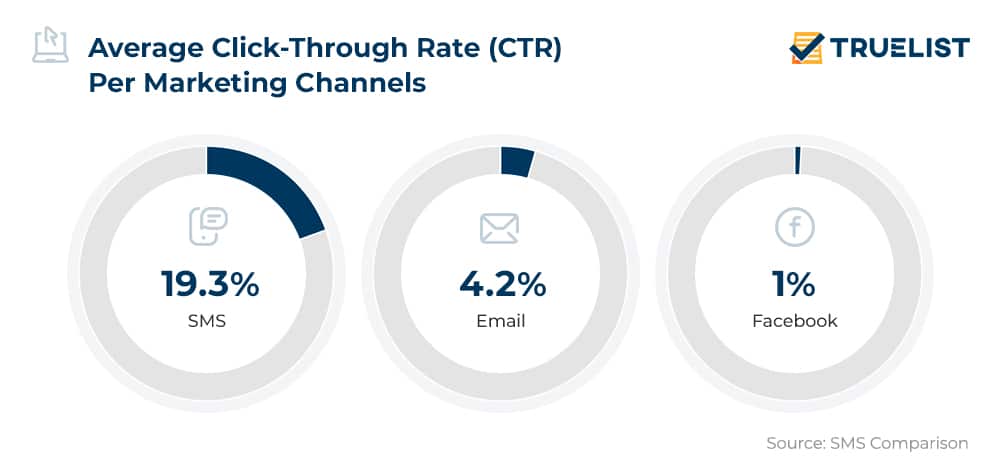
Mobile marketing statistics reveal that almost half of the consumers (48%) in 2020 opted to receive special offers from companies via text messages. Consumer texting statistics further show that the click-through rate for SMS marketing (19.3%) is much higher compared to other marketing channels such as email (4.2%) and Facebook (1%).
(SMS Comparison)
12. 60% of consumers have unsubscribed from business text messages.
More than half (60%) of SimpleTexting respondents say they have unsubscribed from a business’s text messages because they receive too many alerts per brand. Text messages statistics also reveal that 56% of these consumers would like to receive just one text message on a weekly basis.
(Simple Texting)
13. 42% of businesses texted their consumers in 2020.
A 2021 survey conducted on more than 1,300 American businesses, marketers, and customers has revealed that 42% of business owners in the United States have sent text messages to their customers back in 2020.
(Simple Texting)
Texting and Driving Statistics
14. Only 31.6% of American drivers are familiar with their state’s texting while driving laws.
Nearly one-third of drivers in the US claim to be familiar with their state’s texting and driving laws as of 2021. That’s an increase of 2.2% compared to the previous year when only 29.4% of respondents said they were aware of the laws.
(The Zebra)
15. Some 400 fatal crashes take place every year as a consequence of texting while driving.
Despite the multiple benefits of texting, it has a dark side too. Texting accidents statistics by the CDC suggest that as many as 3,000 people die each year as a result of texting and other distractions while driving.
(Bankrate)
16. About 16% of drivers were texting while driving in 2021.
According to a most recent survey conducted by The Zebra, 16.2% of drivers in 2021 were sending text messages while driving, which is a 2.2% decrease in driving and texting rates from the previous year. In addition, it’s been found that more women (52.4%) confessed to texting while driving than men (47.6%).
(The Zebra)
Text Messaging Statistics Worldwide
17. China is the country with the most SMS users in the world.
China has the most SMS users worldwide with close to 1.1 billion people texting daily, followed by India with 730 million users either receiving or sending text messages. Russia is the country with the highest percentage of mobile users where 89% of the population is texting.
(SlickText)
18. 292 million people in the US and Canada use text messaging.
That marks a massive 80% of the population of both countries. It’s no wonder, therefore, that text message marketing statistics point to North America as fertile soil for companies of all sizes to build a strong presence through SMS marketing.
(SlickText)
19. Text messaging usage statistics reveal that 96% of Australians use their phones for texting.
Most Australians use their cell phones primarily to send and receive text messages, data shows. Making and receiving voice or video calls and Google Maps round out the top three of phone use Down Under with 88% and 82%, respectively.
(Statista)
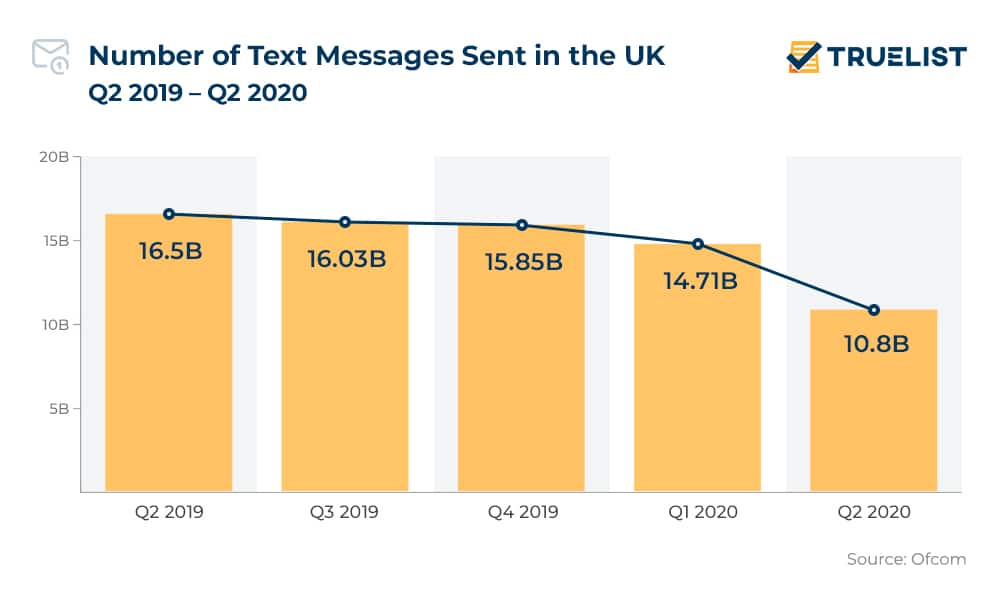
20. 10.8 billion text messages were sent in the UK in Q2 2020.
If you’re wondering how popular texting is on the other side of the pond, a recent Ofcom report shows that just in Q2 2020 10.8 billion text messages were sent. Even though these figures might appear very impressive, there’s a significant decline from the prior-year period when 16.50 billion texts were sent, facts about text messaging reveal.
(Ofcom)
Texting FAQs
How many texts are sent per day?
As many as 23 billion texts are thought to be sent worldwide on a daily basis. This translates to 270,000 texts every second.
(Forbes)
What is the texting capital of the world?
Since Filipinos exchange text messages more often than any other people across the globe, the Philippines is the country with the highest text message volume and has rightfully been called the text capital of the world.
(Senate of the Philippines)
What percentage of texts are lost?
Text messaging facts show that 1-5% of all test messages are lost entirely and never received even during normal conditions when everything is seemingly working well.
(Lifewire)
How many texts does the average person send a day?
When it comes to the average number of texts per day, a recent study shows that consumers send 13 text messages daily on their personal mobile phones.
(Finances Online)
How many texts does the average teenager send a day?
According to teen texting statistics, this group has an incredibly high average number of texts per day by age — as many as 10 text messages per hour, possibly reaching 100 texts per day, if we account for time spent sleeping, etc. What is more disturbing, however, is that one in five teens is also found to be engaging in “sexting”.
(EZTexting)
What is the most common text message sent?
Texted an average of 1,186 per year, “I love you” is the most common text message followed by “When will you be home” that’s texted approximately 1,018 times every year, and “Where are you?” which is texted about 989 times annually, texting statistics indicate.
(Romper)
Sources: SMS Comparison, Mobile Monkey, Marketer Hire, Slicktext, CTIA, Juniper Research, SimpleTexting, The Zebra, Bankrate, Statista, Ofcom, Forbes, Senate of the Philippines, Lifewire, Finances Online, EZTexting, Romper

