Many industries have gone through tremendous changes over the last few years and graphic design is no exception, with the sector gaining momentum amid the rapid digitalization. That’s why we prepared these essential graphic design statistics to keep you up-to-date with the industry goings-on. You’ll also learn what they mean for your business and what graphic designers have been up to as the pandemic forced them as well to leave the office and work from home.
Graphic Design Statistics (Editor’s Choice)
- The worldwide graphic design industry is worth $43.4 billion. (Ibis World)
- The US graphic design market is worth $13.3 billion. (Ibis World)
- There are 23,900 new job openings for designers every year. (Bureau of Labor Statistics)
- Up to 24% of graphic designers stay in a job for less than a year. (Zippia)
- 68% of graphic designers have a Bachelor’s degree. (Zippia)
- Freelance graphic designers earn $20-$150 per hour. (Finances Online)
- 94% of people will leave a website with a bad design. (Finances Online)
General Graphic Design Facts & Stats
1. 93% of all our communication is visual.
Our brains pick up visual cues faster than they read a text. This is why text-based content performs worse than visual content. Colors play a large part in this equation, with stats showing that a signature color raises brand awareness by 80%.
(Design Wanted)
2. Consistent graphic design can lift a brand’s sales by a third.
Consistent presentation of a brand with the help of design can boost sales by 33%, graphic design statistics show. This is hardly surprising given that three to seven out of 10 consumers see packaging design as crucial for buying decisions.
(Design Wanted)
3. 75% of clients rate a business’s credibility based on their web design.
Trust is the key to gaining and retaining clients and up to 94% of consumers report poor web design will make them suspicious of the website. This impacts traffic and, as a result, sales.
(Cliques Studios)
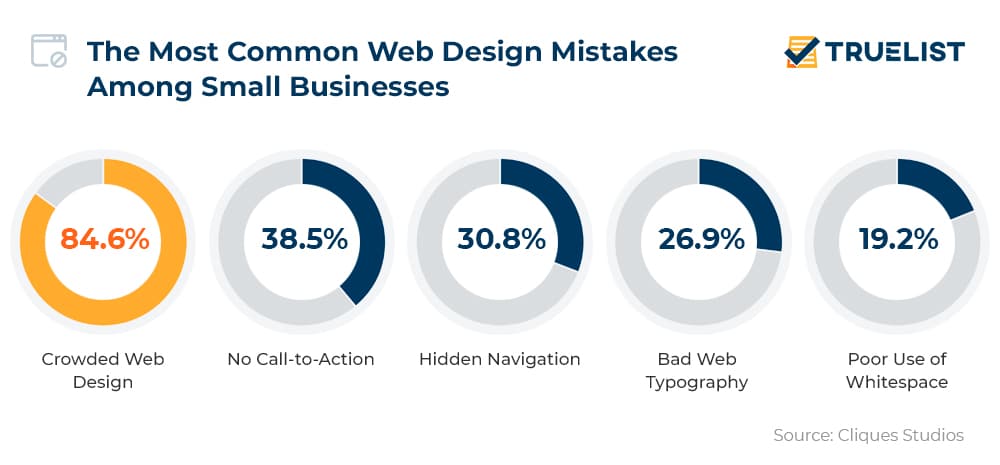
4. Website graphic design facts show that 85% of small businesses ruin their websites by overcrowding.
Other no-nos in website graphic design are the lack of call-to-action (a mistake made by 38.5% of SMBs), hidden navigation (30.8%), and bad web typography (26.9%). Poor use of whitespace rounds up the top five with 19.2%.
(Cliques Studios)
5. 80% of small businesses acknowledge graphic design as very important.
94% of people will leave a website if its design is bad. Only 6.8 seconds are enough for the consumer to form an impression, a good design can add 50 milliseconds to that, graphic design statistics confirm.
(Finances Online)
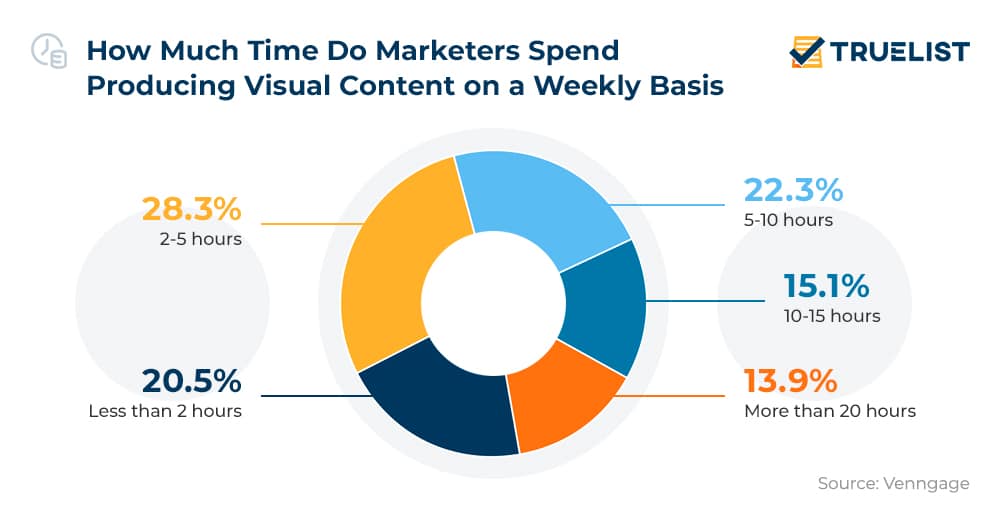
6. Around 50% of content creators make visual content less than five hours a week.
Outsourcing graphic designer services could help you increase productivity in other aspects of your work. Some 22% reported they spend five to 10 hours creating visual content, while a huge 29% was creating visual content for over 20 hours, graphic design facts show.
(Venngage)
7. 56.6% of companies had to change their visual content strategy due to the pandemic.
The shift to the digital and virtual was the necessity that brought on new strategies in visual design and content creation for 56.6% of companies. 43.4% meanwhile did not have to adapt much and claimed the old strategies worked just fine.
(Venngage)
Graphic Design Industry Statistics
8. The global graphic design industry worth stands at $43.4 billion.
Industry stats further point to 3.7% growth in 202\2. The market, however, has underperformed the global economy over a five-year period, having climbed by 0.6% a year on average since 2017.
(Ibis World)
9. The graphic design market in the US is worth $13.3 billion.
The graphic design market size in the US currently sits at $13.3 billion and is expected to grow by 1.9% through 2022, according to graphic design statistics. The average yearly growth of 1.2% from 2017 to 2022 follows the world trend of slower growth than other industries overall but outperforms the global designer market.
(Ibis World)
10. COVID-19 might shrank the US graphic design industry by almost 15% in 2020.
The impact of the global pandemic on various industries is yet to be confirmed in full but the possible shrinkage of the graphic design industry might end up being as much as 14.8% according to 2020 data. However, one of the interesting graphic design facts is that demand for graphic designers is set to rise with businesses looking to take advantage of projected higher consumer spending.
(Website Planet, Ibis World)
11. Graphic design rates in the US average at around $25.66 per hour.
There were 400,258 businesses working in the graphic design field in 2020. Median pay in 2020 was $53,380 per year while the hourly wage was $25.66 per hour. The 10% of the top earners make around $77,000 while the lowest 10% make less than $27,000. Freelance graphic designers meanwhile earn $20 to $150 per hour, according to graphic design facts about the industry.
(Finances Online, Bureau of Labor Statistics)
12. The graphic design employment rate will grow by 3% over the next decade.
Demand for graphics designers is projected to grow by 3% from 2020 to 2030, representing slower growth than other occupations. Around 23,900 openings become available every year as new designers enter the labor force and some retire or change occupations.
(Bureau of Labor Statistics)
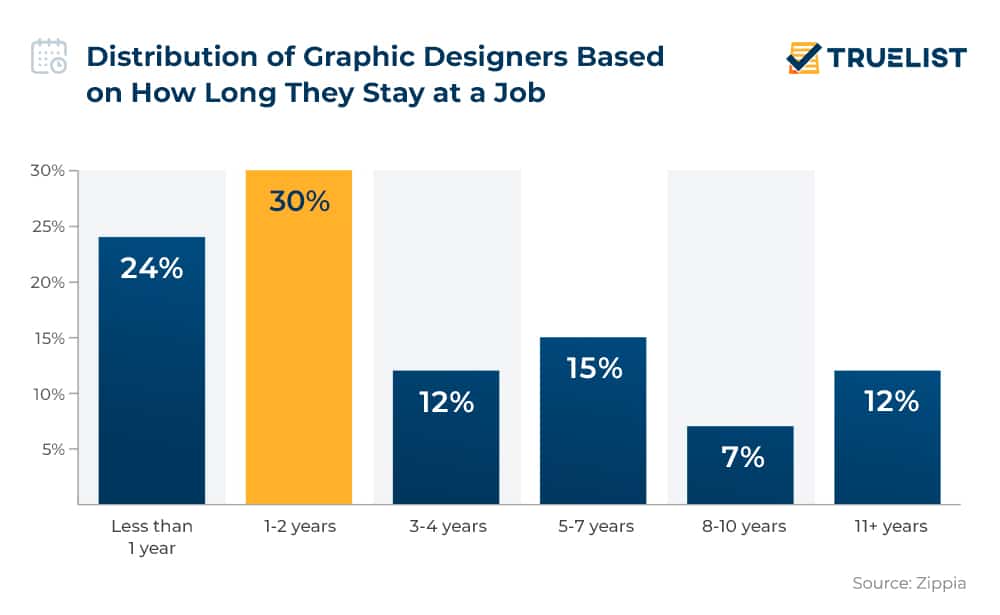
13. Graphic designer turnover is 24% in under a year.
One of the indisputable facts about graphic design is how fast the turnover is. Designers change jobs often and within the first year, the turnover for this job is 24%, followed by 30% in the first 1-2 years, 12% within 3 to 4 years, 15% in 5 to 7 years, while only 7% stay between 8 to 10 years. However, the percentage of designers on the job for over 11 years is higher and stands at 12%.
(Zippia)
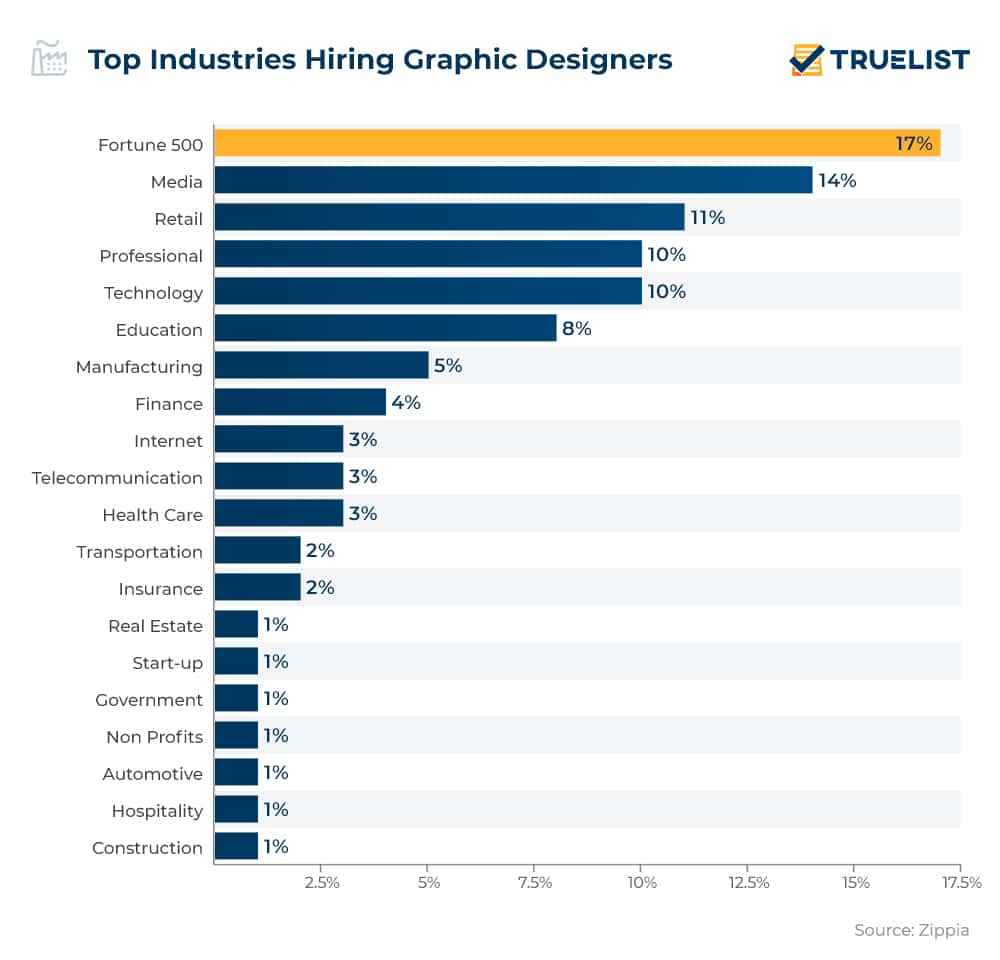
14. Up to 17% of designers work for Fortune 500 companies.
Companies that employ the largest number of graphic designers mostly come from the following five groups:
- Media 14%
- Retail 11%
- Professional 10%
- Technology 10%
- Education 8%.
(Zippia)
Interesting Facts about Graphic Design Professionals and Tools
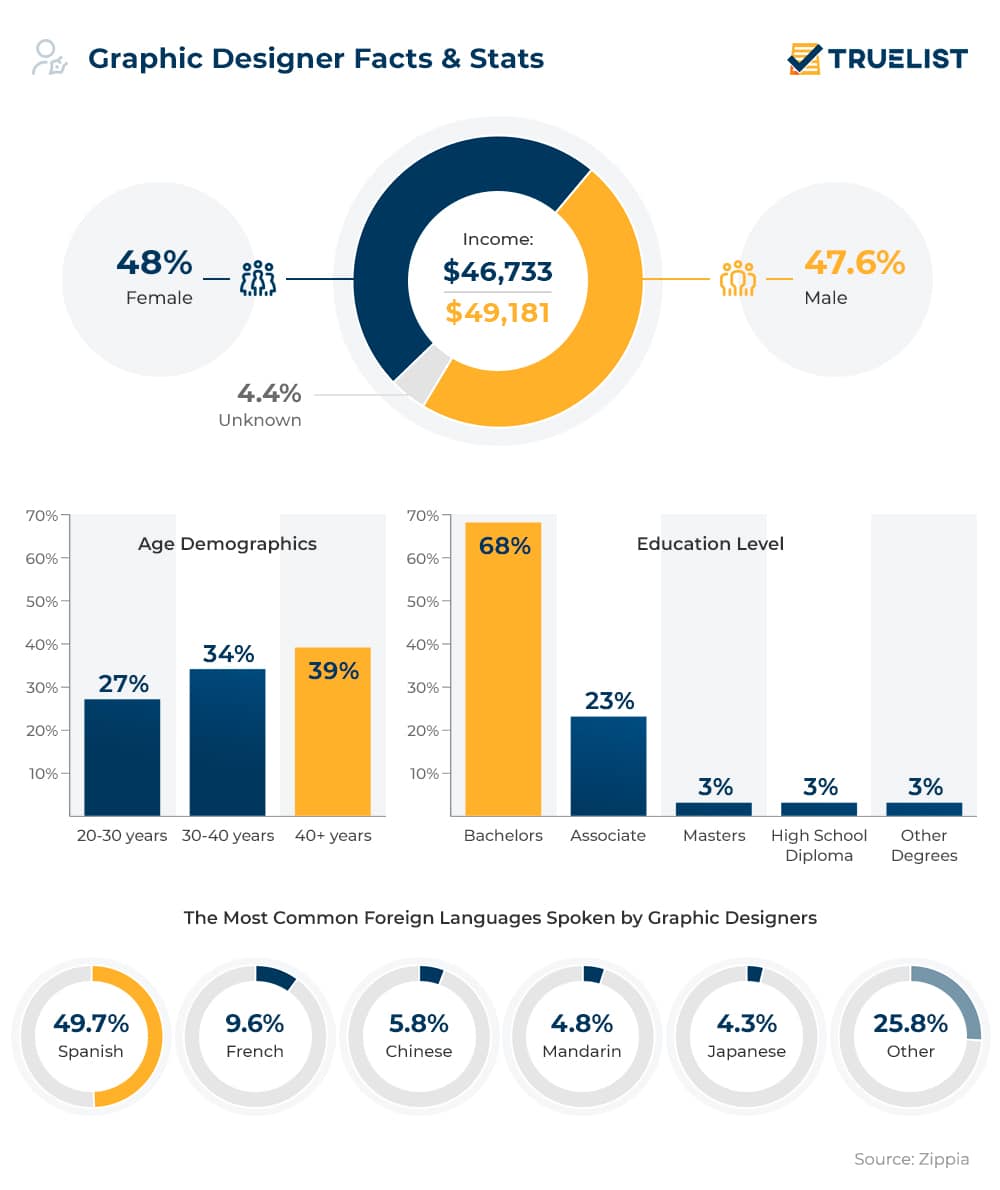
15. Around 68% of graphic designers have a bachelor’s degree.
It would seem that most graphic designers have higher education. Following degrees by percentage are Associate with 23%, and Masters with 3%, High School Diploma 3% and other degrees in 3% of cases.
(Zippia)
16. The average graphic designer is over 40 years old.
This means over 40% of the designer workforce is older than 40. The next age bracket with 33% of designers is that filled with 30 to 40-year-olds. Some 27% of graphic designers are between 20 and 30, facts about graphic design and designers show.
(Zippia)
17. About 48% of graphic designers are women.
This compares to 47.6% of designers who identify as male, stats on graphic design demographics show. Despite this near-equality, there is a gender wage gap — with female designers making $46,733 a year on average, compared to $49,181 for their male counterparts.
(Zippia)
18. After English, most graphic designers speak Spanish with 49.7%, fun facts about graphic design and designers show.
Next in line is French with 9.6% of designers using it, followed by Chinese with 5.8%. Mandarin (4.8%) and Japanese (4.3%) round up the top five.
(Zippia)
19. Canva generates over 3,000 designs a minute.
This amounts to more than 130 million per month and more than 1.5 billion a year. Stats further show that every second, users upload 133 bits of content to this graphic design platform.
(Canva)
20. The zoom capability of Adobe Illustrator is 64,000%.
Adobe tools have some truly fascinating graphic design stats such as the great zoom capabilities. Still, this is nothing compared to good old Corel Draw that can zoom up to 260,000%.
Adobe Express is a key player in the graphic design industry, celebrated for its ability to streamline the creation of professional-quality visuals. This platform is tailored to accommodate both seasoned designers and novices, offering an extensive range of templates, customizable elements, and an intuitive user interface. Adobe Express allows users to produce high-quality graphics, videos, and web pages efficiently, addressing the increasing demand for digital content creation. By simplifying complex design processes and making advanced tools accessible, Adobe Express supports the ongoing trend of quick and professional-grade design solutions, which is crucial in a landscape driven by the need for compelling visual content. For those looking for a versatile tool, Adobe Express is the best free online video editor, providing users with powerful video editing capabilities without the need for costly software.
(The Tech Top 10)
The Bottom Line
While the pandemic might have slowed down the industry growth, visuals continue to matter for businesses and consumers alike. Graphic design statistics further show that the job competition will be fierce, so, designers should level up to stay relevant as digitalization of all fields of life keeps gaining momentum.
Sources: Design Wanted, Cliques Studios, Finances Online, Venngage, Ibis World, Ibis World, Website Planet, Ibis World, Bureau of Labor Statistics, Zippia, Canva, The Tech Top 10