It is not what we read or hear that stays with us the most, it is what we see. This has been the mantra of content marketing for the past few years. The fewer the images, the less interesting the blog post, according to visual content marketing statistics. Video emerged as key to grabbing the audience’s attention, while infographics have proven crucial for retaining information.
The mix of all types of visuals is often the best, and written-only content will likely be hard to come by in the future. So, let’s see what the stats have to show about visual content marketing today.
Visual Content Marketing Stats (Editor’s Choice)
- Eyes process 36,000 visual messages per hour. (Smart Things)
- People remember only 10% of what they heard three days later. (Hubspot)
- Facebook posts with images have double the engagement. (LucidPress)
- 50% of creators spend less than five hours a week on visual content. (Venngage)
- B2C marketers use visuals more than B2B marketers. (Relevance)
- 82% of all global consumer internet traffic will be video in 2022. (Forbes)
- 95% of B2B customers evaluate a company based on visual content. (Ziflow)
- 41% of marketers post visual content two to five times a week. (Venngage)
- 40% of marketers say Covid-19 changed their video strategies. (Ziflow)
General Visual Content Marketing Stats
1. The human eye can process 36,000 visual messages per hour.
This means that the feeling you get, the sense of a scene, is created in one-tenth of a second. And not only that, 90% of all information transmitted to the brain is visual, and the brain processes this type of information 60,000 times faster than text.
(Smart Things)
2. People later remember only 10% of what they hear.
Within three days of hearing something, people remember only 10%. But, add to that a related and relevant image, and the retention rate grows to as much as 65%. It’s no wonder then that visual content marketing statistics suggest that anywhere from 51% to 80% of businesses are very invested in visuals.
(Hubspot)
3. 50% of marketers report spending less than five hours per week making visuals.
22% dedicate between five and 10 hours a week to visual content, while 29% spend between over 10 and more than 20 hours. With marketers becoming more economical with their time, graphic design agencies often fill in the gap to deliver high-quality visual content.
(Venngage)
4. 76% of B2C marketers use pre-produced videos.
Visual content stats say this type of content beats text for B2C marketers. Most of them use video as the main medium but still 67% use illustrations or photos and 59% love infographics. This is not the case with B2B marketers who are more text-oriented. Up to 73% use case studies, while 71% go for whitepapers and ebooks. What’s more, some 62% said that ebooks and whitepapers were most effective while 47% claimed that case studies bring the best results.
(Relevance)
5. Facebook posts with images get more than twice the engagement.
It’s no wonder then that Facebook posts from brands that featured images got 87% of all engagements. Visual content statistics further show that over at LinkedIn, images, as a rule, get a 98% higher number of comments. As for Twitter, tweets with images get a massive 150% more retweets than those without, as well as 18% more clicks.
(LucidPress)
6. 70% of companies invest in the creation of visual marketing strategies.
Around 25% of marketers use content creation for the promotion of products and mainly use video as a medium. They spend most of the time making Facebook content followed by company website content. Only 20%, however, use branded storytelling as a content creation strategy, digital marketing statistics show.
(Hubspot)
7. Facebook lives create 10 times more engagement than classic videos.
And no wonder, going live is a great way to create a sense of urgency, grab attention and activate the FOMO effect within your audience, visual content statistics show. This is important because everyone is on the go since for example, 90% of videos on Twitter are played on mobile devices and 85% of people use multiple devices at once. This is why 73% of videos are two minutes or shorter, to relay their message fast and not lose the battle with our ever-decreasing attention span.
(Hubspot)
8. Over 500 million Instagram accounts use the Stories function daily.
Visual content statistics show that 58% of consumers report that the stories have piqued their interest in a product or brand. Around 70% said they watch Facebook Stories more than Instagram or Snapchat. Stil in 2019, Instagram accounted for 31.8% of all Facebook advertising revenue, marking a significant increase from the 13.2% three years prior.
(Hubspot)
9. User-generated content on Instagram has a better chance of conversion.
On Instagram, content is 4.5% more likely to get conversions if your own customers are making it, visual content marketing statistics show. Naturally, the downside is that this visual content marketing strategy would only work well if you have a massive number of followers.
(Foap)
10. 95% of B2B customers create an opinion and evaluate a company based on its visual content.
This became increasingly important in 2020 when the opinion of a brand could be formed almost exclusively online due to the pandemic and the lack of in-person events, so much that visual content marketing statistics show that as many as 91% of marketers labeled video as the most essential type of brand visual content strategy in 2020.
Up to 86% of B2B companies did not create the content themselves choosing to outsource the job to other teams or digital marketing agencies and another 30% chose to outsource the distribution of their own content.
(Ziflow)
11. 40% of content creators report that Covid changed their video-making strategies for 2020.
Visual content marketing stats show that up to 91% of marketers are happy with the video ROI with the medium having overtaken other types of visual content such as infographics and blog content as the leading form of visual marketing.
(Ziflow)
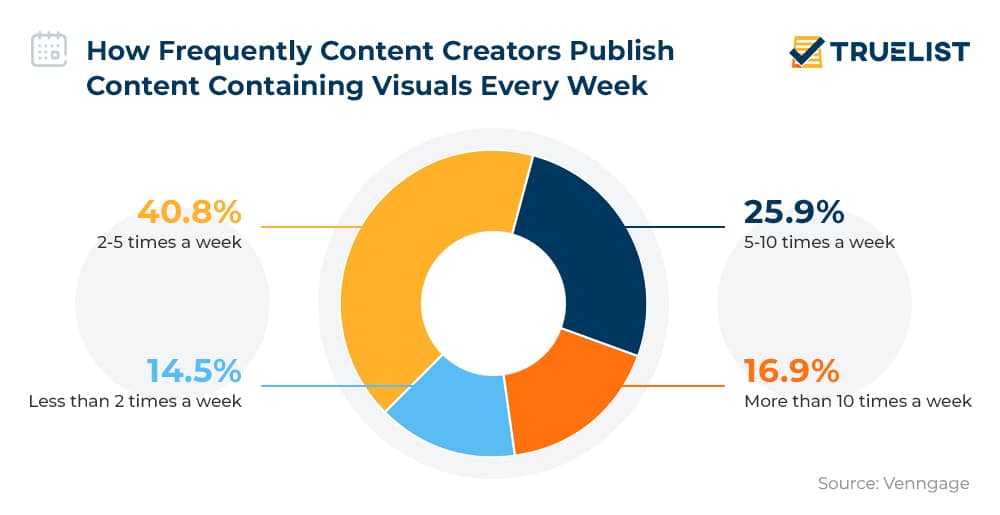
12. 41% of content creators post visuals between two and five times a week.
There are many rules to visual content management and about the number of posts on different networks but in the end, you must test and try what works for you best or hire a content marketing agency to do it for you. Just over a quarter of marketers post visuals between five and 10 times a week, while 17% do so even more times, visual content marketing stats confirm.
(Venngage)
14. 62% of marketers use visuals primarily as part of blog content or landing pages.
Social media follows, with the social media visual content distribution analysis by platform looking like this:
- 49% use visuals for Facebook
- 47% use visuals for Instagram
- 42% use visuals for LinkedIn
- 33% use visuals for Twitter.
Then, 43% of marketers use visuals for print and other types of branding.
(Venngage)
15. Around 42.9 million people in the US used a VR product in 2019.
Another 68.7 million consumers reported using an AR once a month, visual content statistics show. VR for business spending in 2021 was projected at $9.2 billion outperforming spending for VR use for entertainment. Reports further show that tutorials introduced in VR have a 36% better recall rate compared to classic YouTube tutorials.
(Hubspot)
16. 51% of content creators find it hard to create visuals consistently.
Asked to assess the difficulty of consistent visual content creation on a scale of one to 10, the majority of creators scored 5.9 on average, with 51% marking the difficulty between six and nine. Only 12% gave a rating of three or less.
(Venngage)
17. Over 169 million consumers can be reached on Pinterest.
All images and content links, this platform is a visual content creator’s heaven. This is why revenue from shopping ads on the platform grew by a full 100% in 2019, according to visual marketing statistics. The clever use of Pinterest can be and often is an important marketing channel in its own right, especially in the US. Social media marketing statistics also show that pins featuring products and services in action are 67% more likely to generate sales, further underscoring the importance of visual content.
(Hubspot)
18. YouTube has a higher reach than any cable TV network among 18-year-olds.
If you are between 18 and 34 chances are you will stop any activity if you see a notification that your favorite YouTube channel has released new content. At least that’s what 50% of viewers in this age bracket do, according to visual content stats.
(Hubspot)
19. 17% of content marketers spend more than five hours a week creating and distributing infographics.
Infographic statistics show that the process of creating a good-quality infographic is very time-consuming. As the market is oversaturated with mediocre graphics, to stand out, you need to be sure to deliver top-notch content. While you could get a lot else done in five hours, it’s time well spent regardless, with infographics generating three times more likes and shares compared to other content, according to visual content marketing stats.
(Lucid Press, LinkedIn)
The Bottom Line
Visual content marketing strategies are developing and changing fast using the boost of the 2020 pandemic. Short, fun popping bits of content are everywhere these days and generate the most views and leads. It is extremely rare for marketers to publish a piece of text without an image, graph, video, or all of the above.
Visual content marketing statistics are clear, the bond between the consumer and the brand is created and strengthened via visuals, and our attention and retention of information are greatly improved when we have an image to latch onto instead of text and/or sound.
FAQ
How effective is visual content?
Visual content is very effective as the speed at which our brain processes it is 60,000 times faster than the written word. Up to 90% of everything that is received by the human brain during one day is visual. In fact, our attention is driven by images and content with visuals gets 94% more views than content without, according to visual content stats.
(Pole Position Marketing, Relevance, Smart Insights)
How much of marketing is visual?
Marketing trends show the growth of visuals to almost a complete 100% in almost half of the surveyed marketers. For 2020 alone, respondents reported using visual content in 91% to100% of their content. 23% of marketers meanwhile said they used visuals in 70% to 90% of their content.
(Venngage)
Do people prefer visual content?
People definitely prefer visual over written content. Up to 91% have stated that, according to visual content marketing statistics. There, however, is still a bit of disparity of perception, with marketers deeming the following types of content as the most popular for building awareness and interest:
- Blog posts and articles, used by 73% of marketers
- Podcasts, used by 57% of marketers
- Ebooks, used by 56% of marketers
- Videos, used by 54% of marketers.
(Poll Everywhere, Crystal Clear Comms)
Sources: Smart Things, Hubspot, Venngage, Relevance, LucidPress, Foap, Ziflow, LinkedIn, Pole, Position Marketing, Poll Everywhere, Crystal Clear Comms