Marketers always look for new ways to engage with their audience and some of them are, excuse the pun, quite pushy. So, how effective are push notifications as they tread the thin line between useful and annoying? Our push notification statistics will answer these questions and will give you some insight into which industries use them the most.
So, whether you’re just getting started with push notifications or are looking for some new ideas on how to use them, stick with us!
Push Notification Statistics (Editor’s Choice)
- The delivery rate for push notifications is 60% in the evening and afternoon. (Gravitec)
- 70% of users see push notifications as useful. (E Goi)
- Less than 50% of smartphone apps use push notifications. (Digital Commerce 360)
- In-app notifications have a three times higher open rate than push notifications. (Reckless Agency)
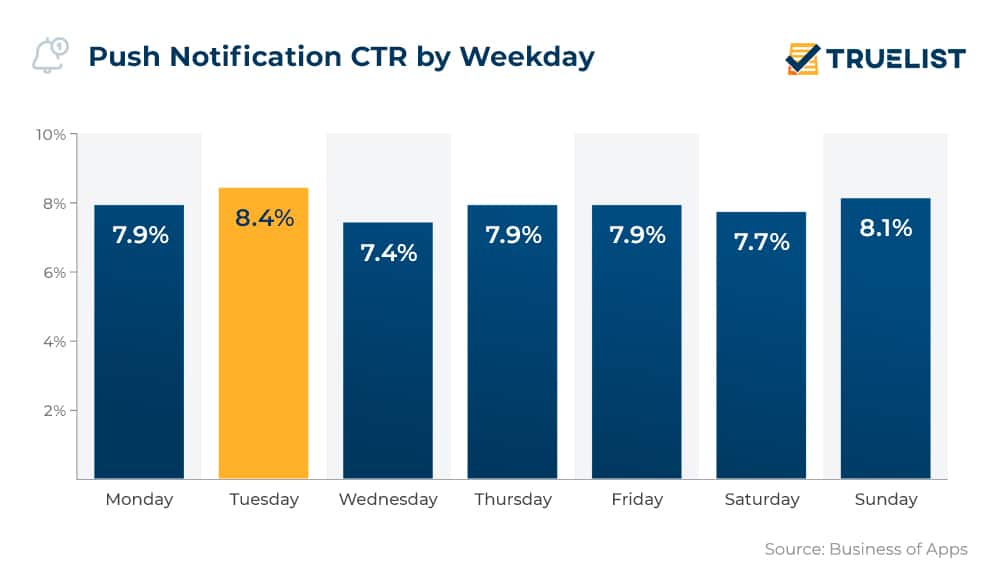
- The best day for a push reaction rate is Tuesday. (Business of Apps)
- 40% of people interact with the app within an hour of getting a notification. (E Goi)
Statistics on Push Notifications
1. Push notification services started with Apple’s iOS 3 mobile operating system in 2009.
Since then, many new products have come to the market, leaving businesses with a touch choice between multiple push notification services. Nowadays, they offer multiple push notification types, including pop-up alerts (such as news items), progress notifications (often used by learning apps), promotional notifications (exclusive deals, discounts, giveaways, etc.), geo-location notifications (most notably weather alerts), payment confirmations, abandoned cart reminders, and delivery tracking alerts.
(Business of Apps)
2. The push notifications opening rate is 50% higher than email marketing opening rates.
Push notifications can have a deliverability rate of 90%, and their click rate is at times 7x higher than that of email marketing, according to push notifications vs email statistics. With segmentation, they further boast a massive 93% retention rate.
(E Goi)
3. In-app notifications have an open rate three times higher than push notifications.
And while push notifications have very enviable rates, in-app alerts seem to be winning the in-app notifications vs push notifications battle. In-app notifications appear within the app itself, while push notifications are messages that pop up on your device’s lock screen or in the notification tray. In-app messaging has an amazing 75% open rate.
(Reckless Agency)
4. The average US smartphone user receives 46 app push notifications per day.
How many of those they would open, however, is partly contingent on their device. Push notifications on Android devices have a higher medium opt-in rate than iOS — 81% vs. 51%, according to push notification stats for iOS and Android. This is because to get users to actively consent, iOS requires they take an extra step of clicking “opt-in,” while with Android, push notifications are automatically enabled.
(Business of Apps)
5. Tuesday holds the highest push reaction rate of 8.4%.
The second day of the week has the best reaction rate, followed by Sunday with 8.1%. In the first case, engagement follows the trajectory of the business week, with Monday easing people into work, leaving them ready to engage on the following day. In the case of Sunday, we have the exact opposite trend — people have had the chance to relax during the weekend and by the end of it, are ready to engage again.
(Business of Apps)
6. With 93%, Chrome is the undisputed leader for web push subscribers.
Web push notifications statistics show that while all browsers support push notifications on mobile and desktop devices, the most popular browser with over 90% of all push subscribers out there is Chrome. The runner-up, Opera, has a meager 3%, Yandex follows with 2%, while Firefox and Safari have 1% each.
(Gravitec)
7. The delivery rate is lowest on desktops at night, with about 20%.
The delivery rate for push notifications seems to be contingent both on the device and time of day. While the overall delivery rate based on time is about 35% at night and early morning and 60% in the evening and afternoon, when we look at mobile push notifications statistics, the average delivery rate is 50-60%, as opposed to 20-30% for desktop.
(Gravitec)
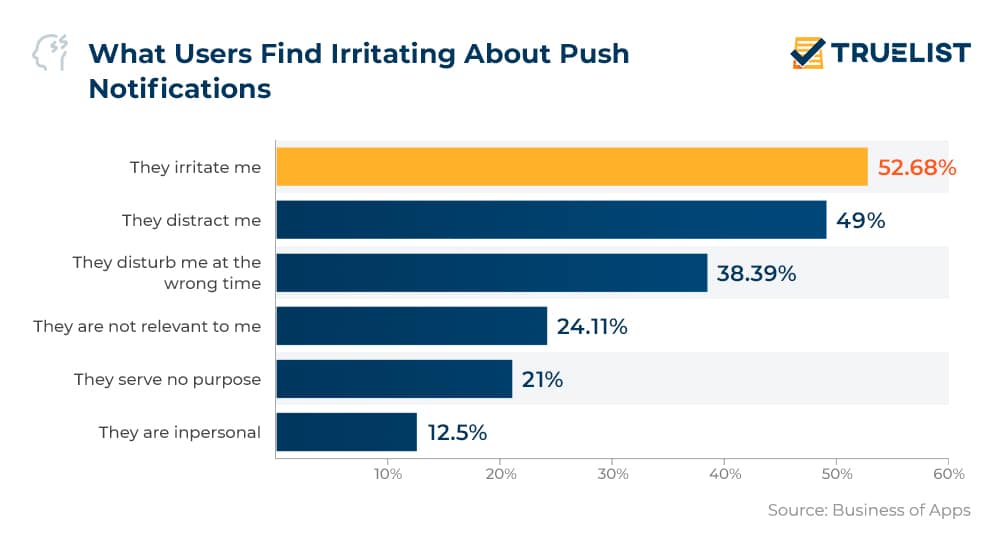
8. Push notifications are irritating for more than half of the recipients.
The key to success is knowing when enough is enough, constantly distracting people will definitely result in failure. More than half of users (52.68%) find them annoying and just as many (49%) think they are distracting.
(Business of Apps)
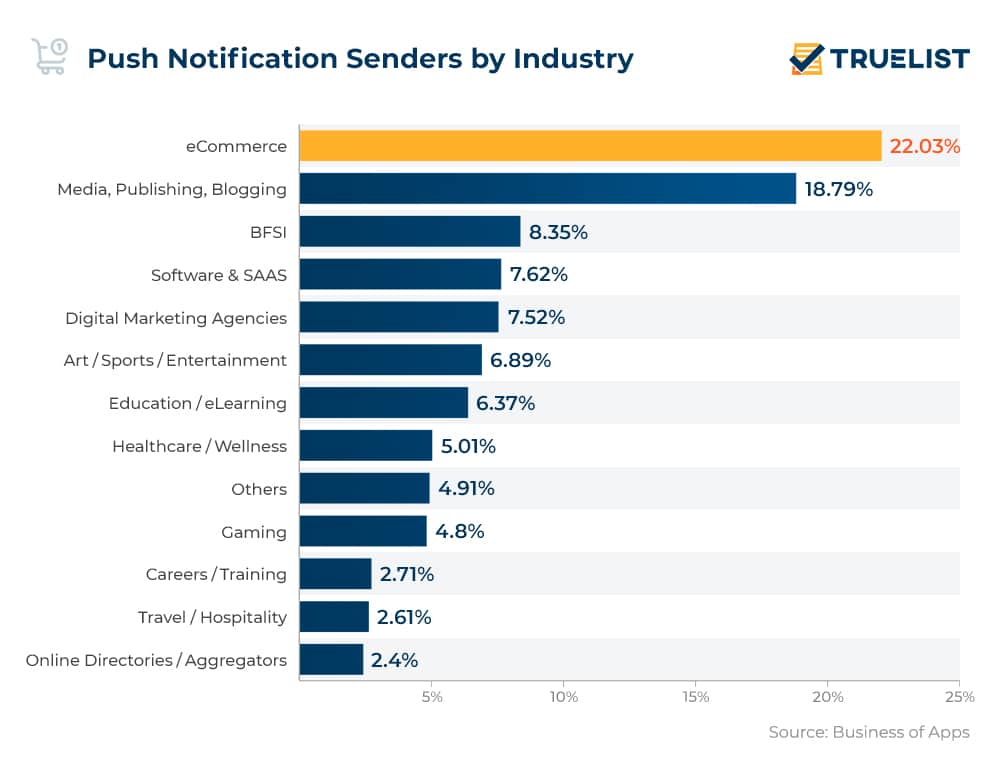
9. Ecommerce accounts for the bulk of push notifications.
With 22.3%, ecommerce is the king of this type of alerts, push notifications for ecommerce statistics show. Media, publishing, and blogging take up the number two spot with 18.79%, meaning these two industries account for some 40% of push notifications.
(Business of Apps)
10. The click-through rate for web push notifications averages around 15%.
However, depending on the content, CTR can go as high as 30%. Your web push CTR depends on the campaign’s settings. You should, therefore, pay attention to:
- The number of times a person sees the campaign
- When you send the notification and when it goes live
- How your notification looks
- What you say in your notification
- Who you target with your notification.
(Gravitec)
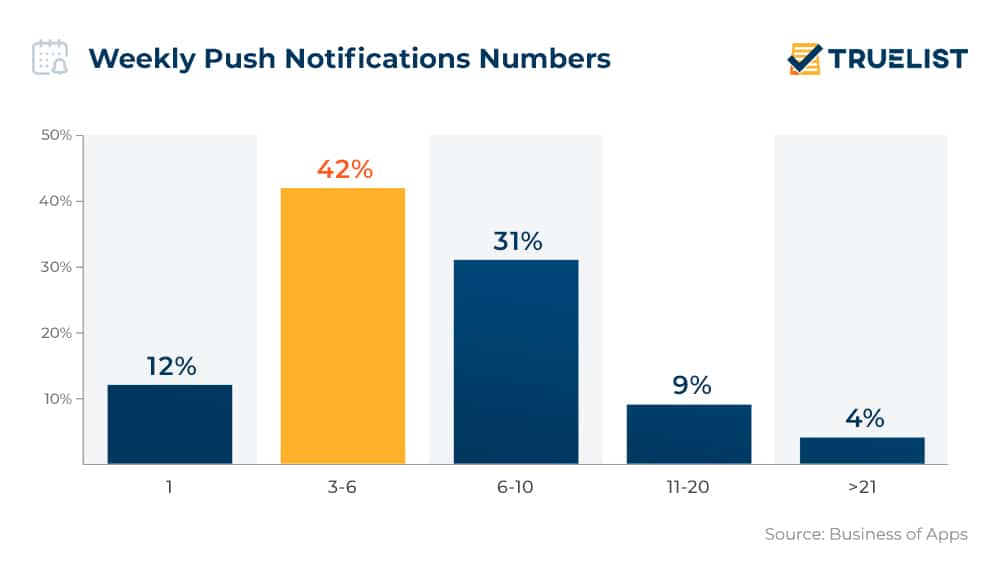
11. Unsubscribes stay under 1% if you stick below up to the five pushes per day.
Sometimes sending 3-4 messages will result in 40% of people being irritated and for 10%, it’s enough to receive one message a week to unsubscribe. Note, however, that push notification stats also show that while some people might not like getting a lot of messages if the messages are interesting, they don’t mind.
(Business of Apps)
The Bottom Line
With the average person checking their phone 150 times a day, it’s more important than ever to make sure your push notifications are well designed and provide value. The use of push notifications can be a great way to increase engagement with your app and keep users coming back. When used correctly, they can provide value to users and help promote your app. However, push notification statistics also show that if they are abused, they can quickly become annoying and lead to users deleting the app. It’s therefore essential to carefully plan how to use them and ensure that the user experience is always positive.
FAQs
What is the average push notification open rate?
The average push notification open rate is 7.8%. However, the answer to this question is easily disputed, as it can range anywhere from a low of 0.2% to 80%, depending on the app, segment, content, campaign type, etc.
(Omnikick)
What is a good conversion rate for push notifications?
When it comes to the push notification conversion rate, sometimes, one genre has better results than others. The key to both questions is choosing the right targets for your campaigns. The rates are the highest in the adventure games segment with 69.57% on average, trivia games with 33.33%, and puzzle or strategy games with 29.43%, push notification usage statistics show.
(Medium)
How many apps use push notifications?
One might expect an answer like “everyone” but in reality, less than 50% of mobile apps use push notifications, according to Appfigures, which is a huge opportunity for developers and segment growth.
(Digital Commerce 360)
What is a good CTR for push ads?
A good CTR means you’re reaching users at the right time with ads that align with their needs and expectations. As a result, they’re more likely to click and engage with your product or service. According to one study, the average for web push notifications is between 5% and 15%. Android push notification stats meanwhile show that a good CTR would be 4.1%, while iOS data places that at 1.7% for iPhones.
(MoEngage)
How many push notifications should you send?
Looking at push notification frequency, you should send no more than three to five notifications per week. Still, this largely depends on the industry, the absolute maximum is two notifications a day, but one works best even for the most frequent sending apps. Keep in mind to always send relevant content.
(Sellbrite, Push Engage)
What is the best time to send a push notification?
The truth is that push notifications can be annoying, especially if they are sent too often or are poorly targeted. This is why timing your notifications correctly is so important for engagement success.
The best time to send push notifications for different demographics, according to push notification statistics is:
- Working-class: 9 am, 12-2 pm, 9-11 pm
- Young mothers: 11 am-12 pm, 7 pm-8 pm
- Middle-aged housewives: 12-2 pm, 9-11 pm
- Students: 9-12 am, 7-2 am.
(iZooto)
Sources: Gravitec, E Goi, Digital Commerce 360, Reckless Agency, Business of Apps, Business of Apps, Omnikick, Medium, MoEngage, Sellbrite, Push Engage, iZooto