Anyone who has ever had to call a customer service line knows that it can sometimes be an excruciating experience. You wait on hold for what seems like hours, only to be connected to someone who can’t help you or doesn’t understand your problem. But believe it or not, there is actually some science behind how call centers work. That’s why we prepared these call center statistics to help you make the most out of your next phone call or to give you some insight into how to set up a call center to support your business venture.
Call Center Statistics (Editor’s Choice)
- The global market for contact center services will reach $496 billion by 2027. (Statista)
- There are 1.15 million call center employees in the US. (Magellan Solutions )
- Up to 77% of call center employees say they are stressed out. (Uniphore)
- The call center turnover rate can reach 45%. (Replicant)
- The average contact center handling time is six minutes. (Live Agent)
- 60% of customers will hang up after 60 seconds on hold. (Plum Voice)
- The average call center takes 4,400 calls a month, 1,000 in a week, and misses 48. (Live Agent)
Call Center Industry Statistics
1. In 2020, The global contact center market size was $339 billion.
Contact centers are constantly being heralded as one of the most important industries to have in this day and age. This is reflected by the expected growth rate, which will see the sector’s market size soar to $496 billion by 2027.
(Statista)
2. The number of call center employees is expected to rise by 15% by the end of 2022.
The number of people working in call centers has been on the rise and is expected to have climbed by 15% by the end of 2022 — from 1.15 million currently to 1.8 million. One of the reasons for this projected surge is more efficient hiring techniques.
(Magellan Solutions)
3. The lower end of the turnover rate scale for call centers is still high at 30%.
Call center turnover statistics show that the industry’s turnover rate averages between 30% and 45%. When you lose a representative, not only do they abandon their expertise with your company but also all that investment put into hiring them as well.
(Replicant)
4. 87% of call center workers report “very high” or “high” stress levels.
The call center industry is known for being stressful and the workers often experience high levels of stress. A study done by Cornell University found that 87% reported “high” or “very high” workplace tension. Call center stress statistics also show that 77% of customer service employees say the same about their personal lives.
(Uniphore)
5. Outsourced call centers have the highest absenteeism rate of 10%.
Research done by Cornell University showed that call center absenteeism on a normal day has an average of 6%, and the highest rates can be found in outsourced call centers at 10% and retail at 9.3%. Then, 56% of organizations do not have a formal absenteeism policy in place. Call center absenteeism statistics meanwhile show. While most people assume that the primary reason for absenteeism is an illness, this is not always the case. In fact, personal reasons are the leading cause. Stats further show that call center workers are absent for an average of 8.2 days a year, compared to an average of 7.4 days for other industries.
(Avoxi)
6. The global cloud market was predicted to reach $236 billion by 2020.
Cloud-based call center statistics show that this type of center is a popular alternative for those who want to avoid the high cost of renting dedicated space. The cloud acts as an ACD and IVR system, so you don’t need extra hardware in your office or home. This type of contact center has six main benefits:
- Greater agent versatility
- Improved agent efficiency.
- Greater scalability
- Reduced costs
- Enhanced security
- Superior customer experiences.
(Vocalcom, Nice)
Call Center Benchmark Statistics
7. The service benchmark for contact centers is to answer 80% of calls in 20 seconds.
The average duration of each customer interaction or the average handle time for a call center agent meanwhile stands at six minutes and 10 seconds. This number, which is among the most important call center metrics, can be used to calculate similar metrics about other channels, like messaging or chat where the standard AHT varies based on the industry. Naturally, to ensure high rates across all communication channels, a lot of businesses outsource to answering services.
(Zendesk, Live Agent)
8. Call center hold time statistics show that 60% of clients will hang up after one minute on hold.
These days people are always busy and they don’t have time for things that take too long. In a survey of 2,500 consumers from Velaro, almost 60% of the respondents said that 60 seconds on hold is too much. Nearly a third (32.3%) meanwhile believe that customer service should answer without any hold time.
(Plum Voice)
9. The global call center’s first contact resolution rate ranges from 70 to 75%.
Call center stats point to FCR as the global benchmark for how many calls are resolved during the initial conversation with a customer. As one of the typical call center metrics, it indicates that most agents can resolve problems on their own without needing to follow up or do extra tasks to find a solution. While one study places the FCR in a much wider range — between 41% to 90% — it follows that call center companies with high-skilled employees have a much better FCR.
(Pointillist)
10. The average call center calls per day number is around 200.
The average call center has 4,400 calls a month, 1,000 in a week, and misses 48 of them, inbound call center statistics show. This can be different depending on your company size as well as what industry you’re working in. As for the average calls per hour in a call center, stats show that, on average, call center agents spend 31.8 min out of an hour talking to customers.
(Live Agent)
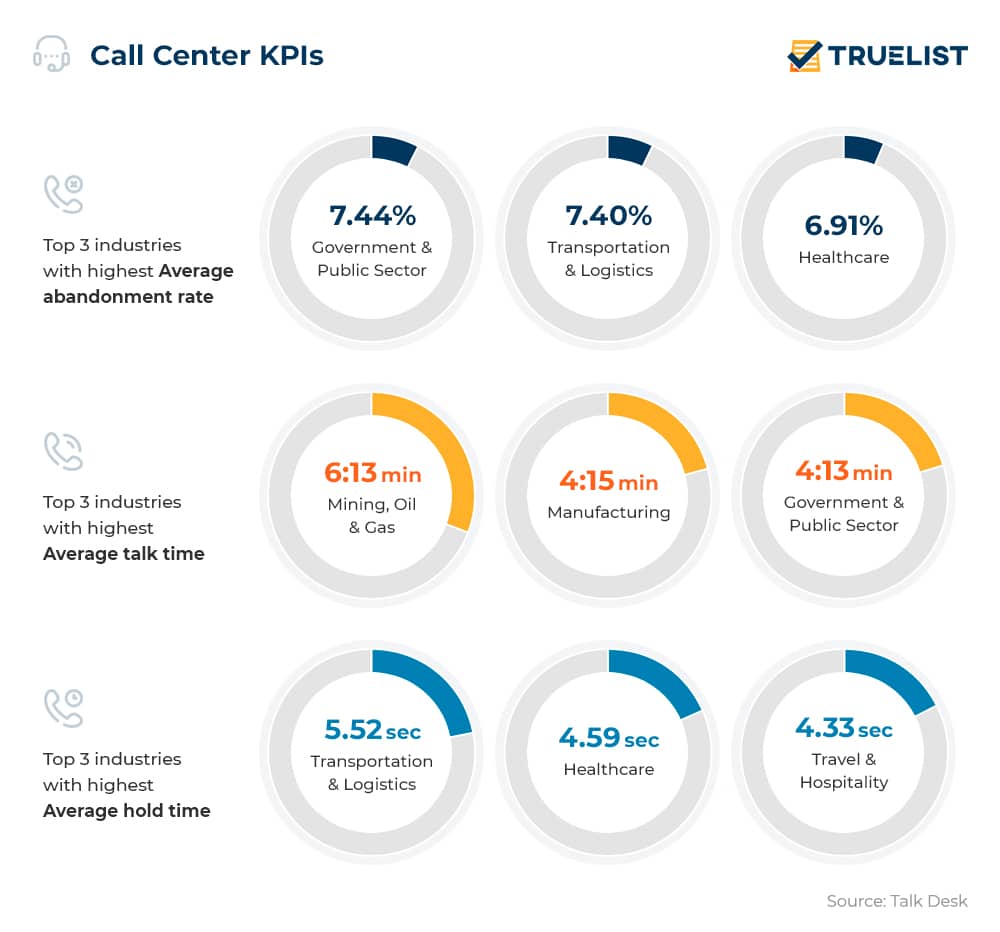
11. The average hold time in Transportation and Logistics is 5.52 seconds.
Call center KPI benchmarks by industry show that the average hold time is 5.52 seconds for Transportation and Logistics, 4.59 seconds for Healthcare, and 4.33 seconds for Travel and Hospitality. The average abandonment rate in the Government and Public Sector is 7.44%, for Transportation and Logistics it stands at 7.40%, and for Healthcare, it’s 6.91%, call center stats show. The average talk time for Mining, Oil, and Gas is 6:13 minutes, Manufacturing has 4:15 minutes of ATT, and for the Government and Public Sector — 4:13 minutes.
(Talk Desk)
12. Banks still rely on live call center agents more than AI in over 60% of cases.
Bank call center statistics show mobile customer service apps are becoming more popular as they offer a number of features that can replace traditional call centers. These include being able to message live agents or ask questions through AI assistants in the mobile app, but only 36% to 40% out of 25 major banks support this type of communication, call center industry standard metrics show.
(eMarketer)
The Bottom Line
The call center industry is booming, with more and more businesses moving their customer service operations to offshore locations. Call centers have become ubiquitous in the business world, and for a good reason. If you’re looking to improve your customer service or take your sales process to the next level, these call center statistics can help you decide if having a call center could be the right choice for you.
Sources: Statista, Magellan Solutions, Uniphore, Replicant, Live Agent, Plum Voice, Magellan Solutions, Avoxi, Vocalcom, Nice, Zendesk, Pointillist, Talk Desk, eMarketer