Ever wondered whether your website would attract more traffic if you switched its layout around? Or whether your marketing strategy can be improved with some slight tweaks? A/B testing statistics show it’s certainly worth giving this methodology a try and see what works best for your business. Still not sure? Check out our list of eye-opening facts on A/B testing to bring your business to the next level.
A/B Testing Statistics (Editor’s Choice)
- By 2025, the global A/B testing software market is projected to be worth $1.08 billion. (QY Research)
- A/B testing statistical significance can be reached with a minimum of 5000 unique visitors. (AB Tasty)
- Some 52.8% of CROs don’t have a standardized stopping point for conducting A/B tests. (CXL)
- 77% of organizations do A/B testing on their website and 60% on their landing page. (InvespCRO)
- 93% of US companies do A/B testing on their email marketing campaigns. (Marketing Land)
- 59% of organizations run A/B testing on emails. (InvespCRO)
- Simple subject lines get 541% more responses than creative ones. (Marketing Sherpa)
General A/B Testing Stats
1. By 2025, the global A/B testing software market is projected to be worth $1.08 billion.
According to statistics from QY Research, the A/B testing software market was worth $485 million in 2018, and expectations are that it will continue to grow. In fact, the report shows that the yearly growth will remain steady at 12.1% by the end of 2025, when it is expected for the industry to reach a little over a billion US dollars.
(QY Research)
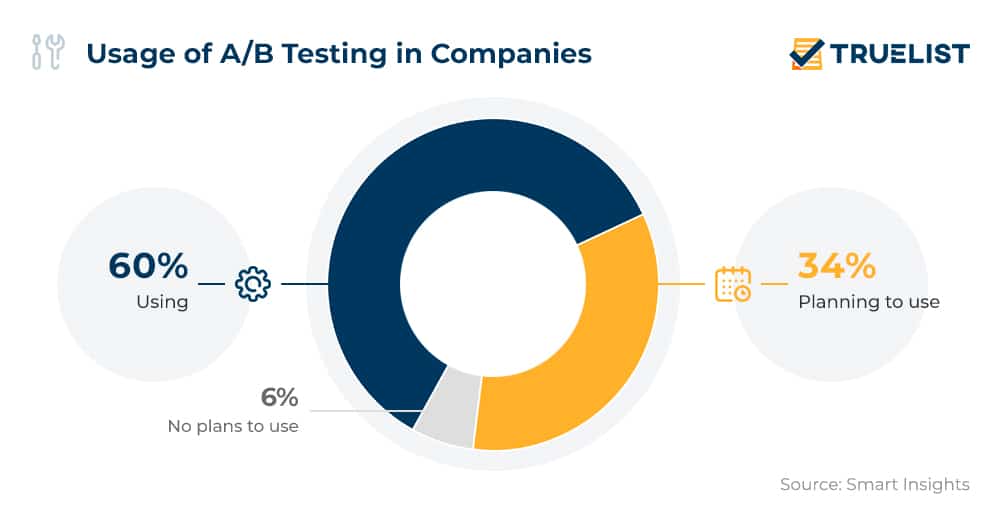
2. A/B testing stats indicate it is the #1 CRO method.
With 60% of companies already using it and another 34% planning to use it, A/B testing is the number one method used by marketers to optimize conversion rates, according to recent reports. Copy optimization is employed by 59% of marketers in their daily work, while another 29% plan to adopt it. In addition to A/B testing, surveyed marketers said they also rely on online surveys and customer feedback (58%), as well as customer journey analysis (55%). Usability testing is the gateway to optimizing conversion rates for 49% of companies.
(Smart Insights)
3. 60% of organizations find A/B testing to be highly valuable for optimizing their conversion rates.
Although there are numerous factors that can affect conversions, recent A/B testing statistics show most businesses believe it is one of the best ways to improve it. Almost two-thirds (63%) don’t find A/B testing hard to implement. Just 7% disagree, admitting that the implementation of A/B testing is a daunting task.
(InvespCRO)
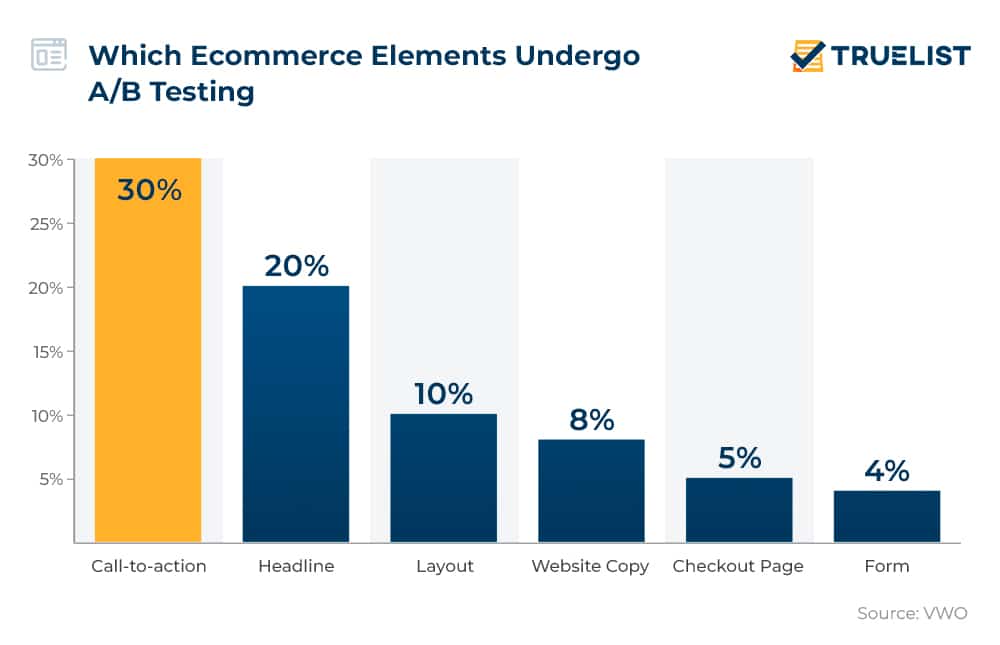
4. Successful A/B testing can bring a 50% increase in the average revenue per unique visitor for ecommerce sites.
When successful, A/B testing can pay off massively. Ecommerce websites generate an average revenue of $3 per unique visitor. With properly conducted A/B testing, this revenue climbs even higher. A/B testing trends reveal one-third of A/B testers first start evaluating elements such as the call-to-action button, 20% test headlines, 10% test layouts, and 8% website copies.
(VWO)
5. A/B testing statistical significance can be reached with a minimum of 5000 unique visitors.
Failure to attract enough visits is one of the main reasons why so many marketers can’t get the desired results from A/B testing. Just one in seven A/B tests are statistically significant enough to boost conversion rates, according to A/B testing stats. Another study shows that to reach statistical significance or a 95% reliability rate, you need an A/B testing sample size of 5,000 unique visitors per variation and 100 conversions on each objective by variation.
(AB Tasty)
6. 52.8% of CROs don’t have a standardized stopping point for conducting A/B tests.
A vital component in a company’s CRO process is the utilization of prioritization frameworks, i.e. systems for prioritizing tests. A/B testing analysis indicates a great number of companies are improving, while A/B testing statistics point to a solid 56.4% of companies using a test prioritization framework. The good news is that compared to the year before, the number of companies that were not using a test prioritization framework (43.6%) has now increased to 47.1%.
(CXL)
7. A/B testing scores 4.3 out of 5 in CRO methods efficiency ranking by optimization professionals.
A/B testing is highly rated among conversion rate optimization experts, according to a report by CXL and VWO. Optimization & A/B testing statistics disclose that when asked to rate the efficiency of existing CRO methods, professionals gave A/B testing a score of 4.3 out of 5. This clearly indicates that there are not many other tools that offer marketers so much insight along with the possibility to test out virtually every idea and strategy.
(Finances Online)
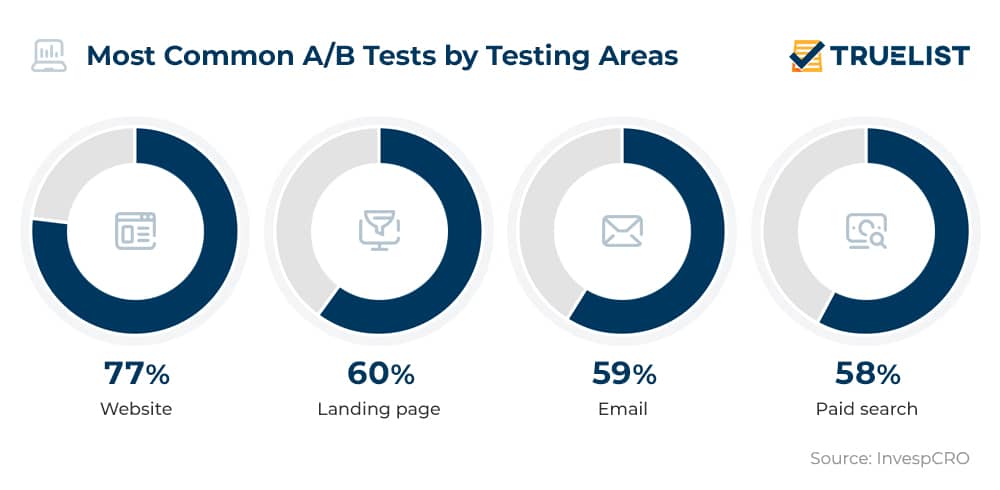
8. 77% of organizations perform A/B testing on their website and 60% on their landing page.
Corporate websites are the most common target of A/B testing, with 77% of organizations running such tests in a bid to improve their CRO. 71% do 2-3 such tests monthly. Landing page A/B testing statistics meanwhile reveal landing pages are where conversions happen and are extremely important for every online business. It’s no surprise then that 60% of all organizations experiment with this methodology in a bid to improve their website’s performance.
(InvespCRO)
9. Under a third of marketers are happy with conversion rates after A/B testing.
Only 28% of marketers are actually satisfied with the conversion rates achieved after A/B testing. The reason: it’s all about how you do it. A/B testing is only effective when done right, so make sure to put some extra effort into your methodology.
(CXL)
A/B Testing Email Statistics
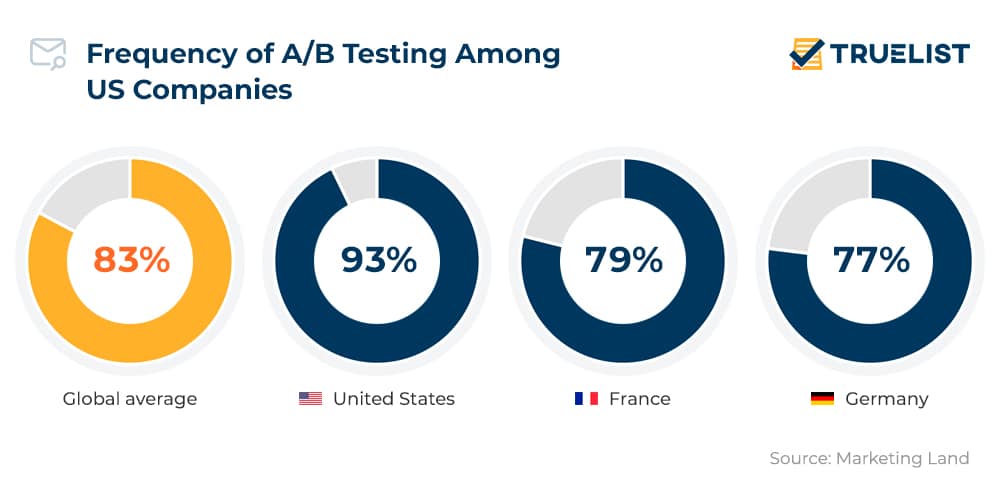
10. 93% of US companies do A/B testing on their email marketing campaigns.
US marketers were among the first to adopt the A/B testing data science in their strategies, which is why it should come as no surprise that the majority of companies rely on this method. What is also true is that US marketers do it most, especially when it comes to their email marketing campaigns and assessing their success rate. In France, 79% of companies apply A/B testing to their email campaigns (sometimes or most of the time), while in Germany this share is 77%, as email marketing stats highlight.
(Marketing Land)
11. Emails with a real person’s name as the sender can generate 0.53% more opens.
Email marketing A/B testing statistics can sometimes show figures that seem insignificant but bring noticeable improvements on a larger scale. For example, sending a more personal email from an individual instead of a company in the ‘Sender’ field increases open and click-through rates by 0.53% and 0.23%, respectively.
(Campaign Monitor)
12. 59% of organizations run A/B testing on emails.
Email marketing is another popular conversion channel and may just as well be the area where more marketers should be performing tests. Email-related A/B testing trends show that 59% of organizations are already implementing this practice. Another 58% perform A/B testing on paid search campaigns.
(InvespCRO)
13. 39% of companies worldwide test an email’s subject.
A solid 39% of companies worldwide start by testing the email’s subject line as the most important element, the bait used to lure customers into clicking. Email marketing A/B testing statistics further show 37% test content, while 36% test the send dates and time. Other things that are subjected to A/B testing are offers (28%) and preheaders (23%).
(Finances Online)
14. Simple subject lines get 541% more responses than creative ones.
A/B testing results from analyzing email subject lines reveal ‘creativity is dead’. Users don’t seem to appreciate when emails try to be clever with subject lines. Email marketing A/B testing facts show that keeping things straight and remaining clear and concise in the subject line is what your potential clients value the most.
(Marketing Sherpa)
15. A/B tests produce a significant change for an organization in 1 out of 8 cases.
Sometimes, even if you opt for the best A/B testing methodology, the results can be frustrating. Data shows that only one out of eight A/B tests indicate any success in an email campaign, with the rest rarely showing any improvement. To avoid this frustration and improve the conversion rate, it is always recommended for companies to use more variables.
(Invesp CRO)
A/B Testing Results and Examples that Made History
16. A/B testing statistics reveal Microsoft Bing runs as many as 1,000 A/B tests per month.
Large organizations are running so many of these tests that we’re likely involved in one of them every time we access the internet. Testing even the most subtle aspects of their UX, Bing runs over a thousand tests each month.
(Marketing)
17. Bing increased its revenue by 12% with an A/B test.
Back in 2012, one of Microsoft’s employees came up with an idea to slightly change how ad headlines are displayed in a Bing search. A/B testing statistics for his idea showed incredible figures and helped Microsoft increase its annual revenues by $100 million in the US alone and has so far been the best idea in the history of Bing.
(Harvard Business Review)
18. The Obama campaign raised $75 million thanks to A/B testing.
Former President Barack Obama’s 2008 US presidential campaign is perhaps one of the best and most famous examples of outstanding A/B testing results. In fact, the A/B testing email statistics Obama’s digital marketing team compiled provide interesting case study material. They tested out various photos, videos, and website layouts, which increased the campaign’s website sign-up rate by a whopping 140%, boosting the funds gathered by a massive $75 million. One of the many A/B tests they ran was in relation to the buttons ‘Learn More’, ‘Join Us Now’, and ‘Sign Up Now’ which revealed that ‘Learn More’, as opposed to the default ‘Sign Up’ collects almost 20% more signups per visitor. Statistics behind A/B testing show this brought in around 4 million email list sign-ups.
(Wired)
19. Google ran its first A/B test in 2000 and nowadays the number of A/B tests it does exceeds 10,000 per year.
Google carried out its first A/B testing way back in 2000, in a bid to determine how many search results they should display per page. Then, 10 years later, Google was running around 7,000 of these tests per year. Currently, A/B testing facts reveal the number of A/B tests Google runs amounts to over 10,000 per year.
(Harvard Business Review, Learning Hub)
20. Google conducted A/B testing for 50 different shades of blue for their CTA.
To find which one converted the most users, Google tested out 50 shades of blue for their call-to-action. By using the A/B testing analysis for the colors, other companies also boosted conversions. For example, SAP increased their conversion rate by 32.5% by using the color orange, while statistics behind A/B testing conducted by Performable showed that the company improved their conversion rate by 21% by using the color red.
(Quicksprout, HubSpot)
Conclusion
Converting visitors into paying customers is the ultimate goal of any online business. We all want to see the valuable traffic coming in from our ad campaigns convert into successful sales. A/B testing statistics suggest this research methodology may be just the right tool to give you an idea if you are on the right track to optimization and ultimately help you secure more happy customers online.
Sources: QY Research, AB Tasty, CXL, InvespCRO, Marketing Land, Marketing Sherpa, Smart Insights, VWO, Finances Online, CXL, Campaign Monitor, Marketing, Harvard Business Review, Wired, Learning Hub, Quicksprout, HubSpot

